AI > Generate Dashboard Items
Learn how to use the AI Assistant on a Draxlr dashboard to describe the charts you want and have AI add them to the dashboard you're on.
The AI Assistant on a dashboard turns a plain-English description into dashboard items. Describe the numbers and charts you want, and Draxlr AI builds the queries, picks the visualizations, and adds them to the dashboard you're on.
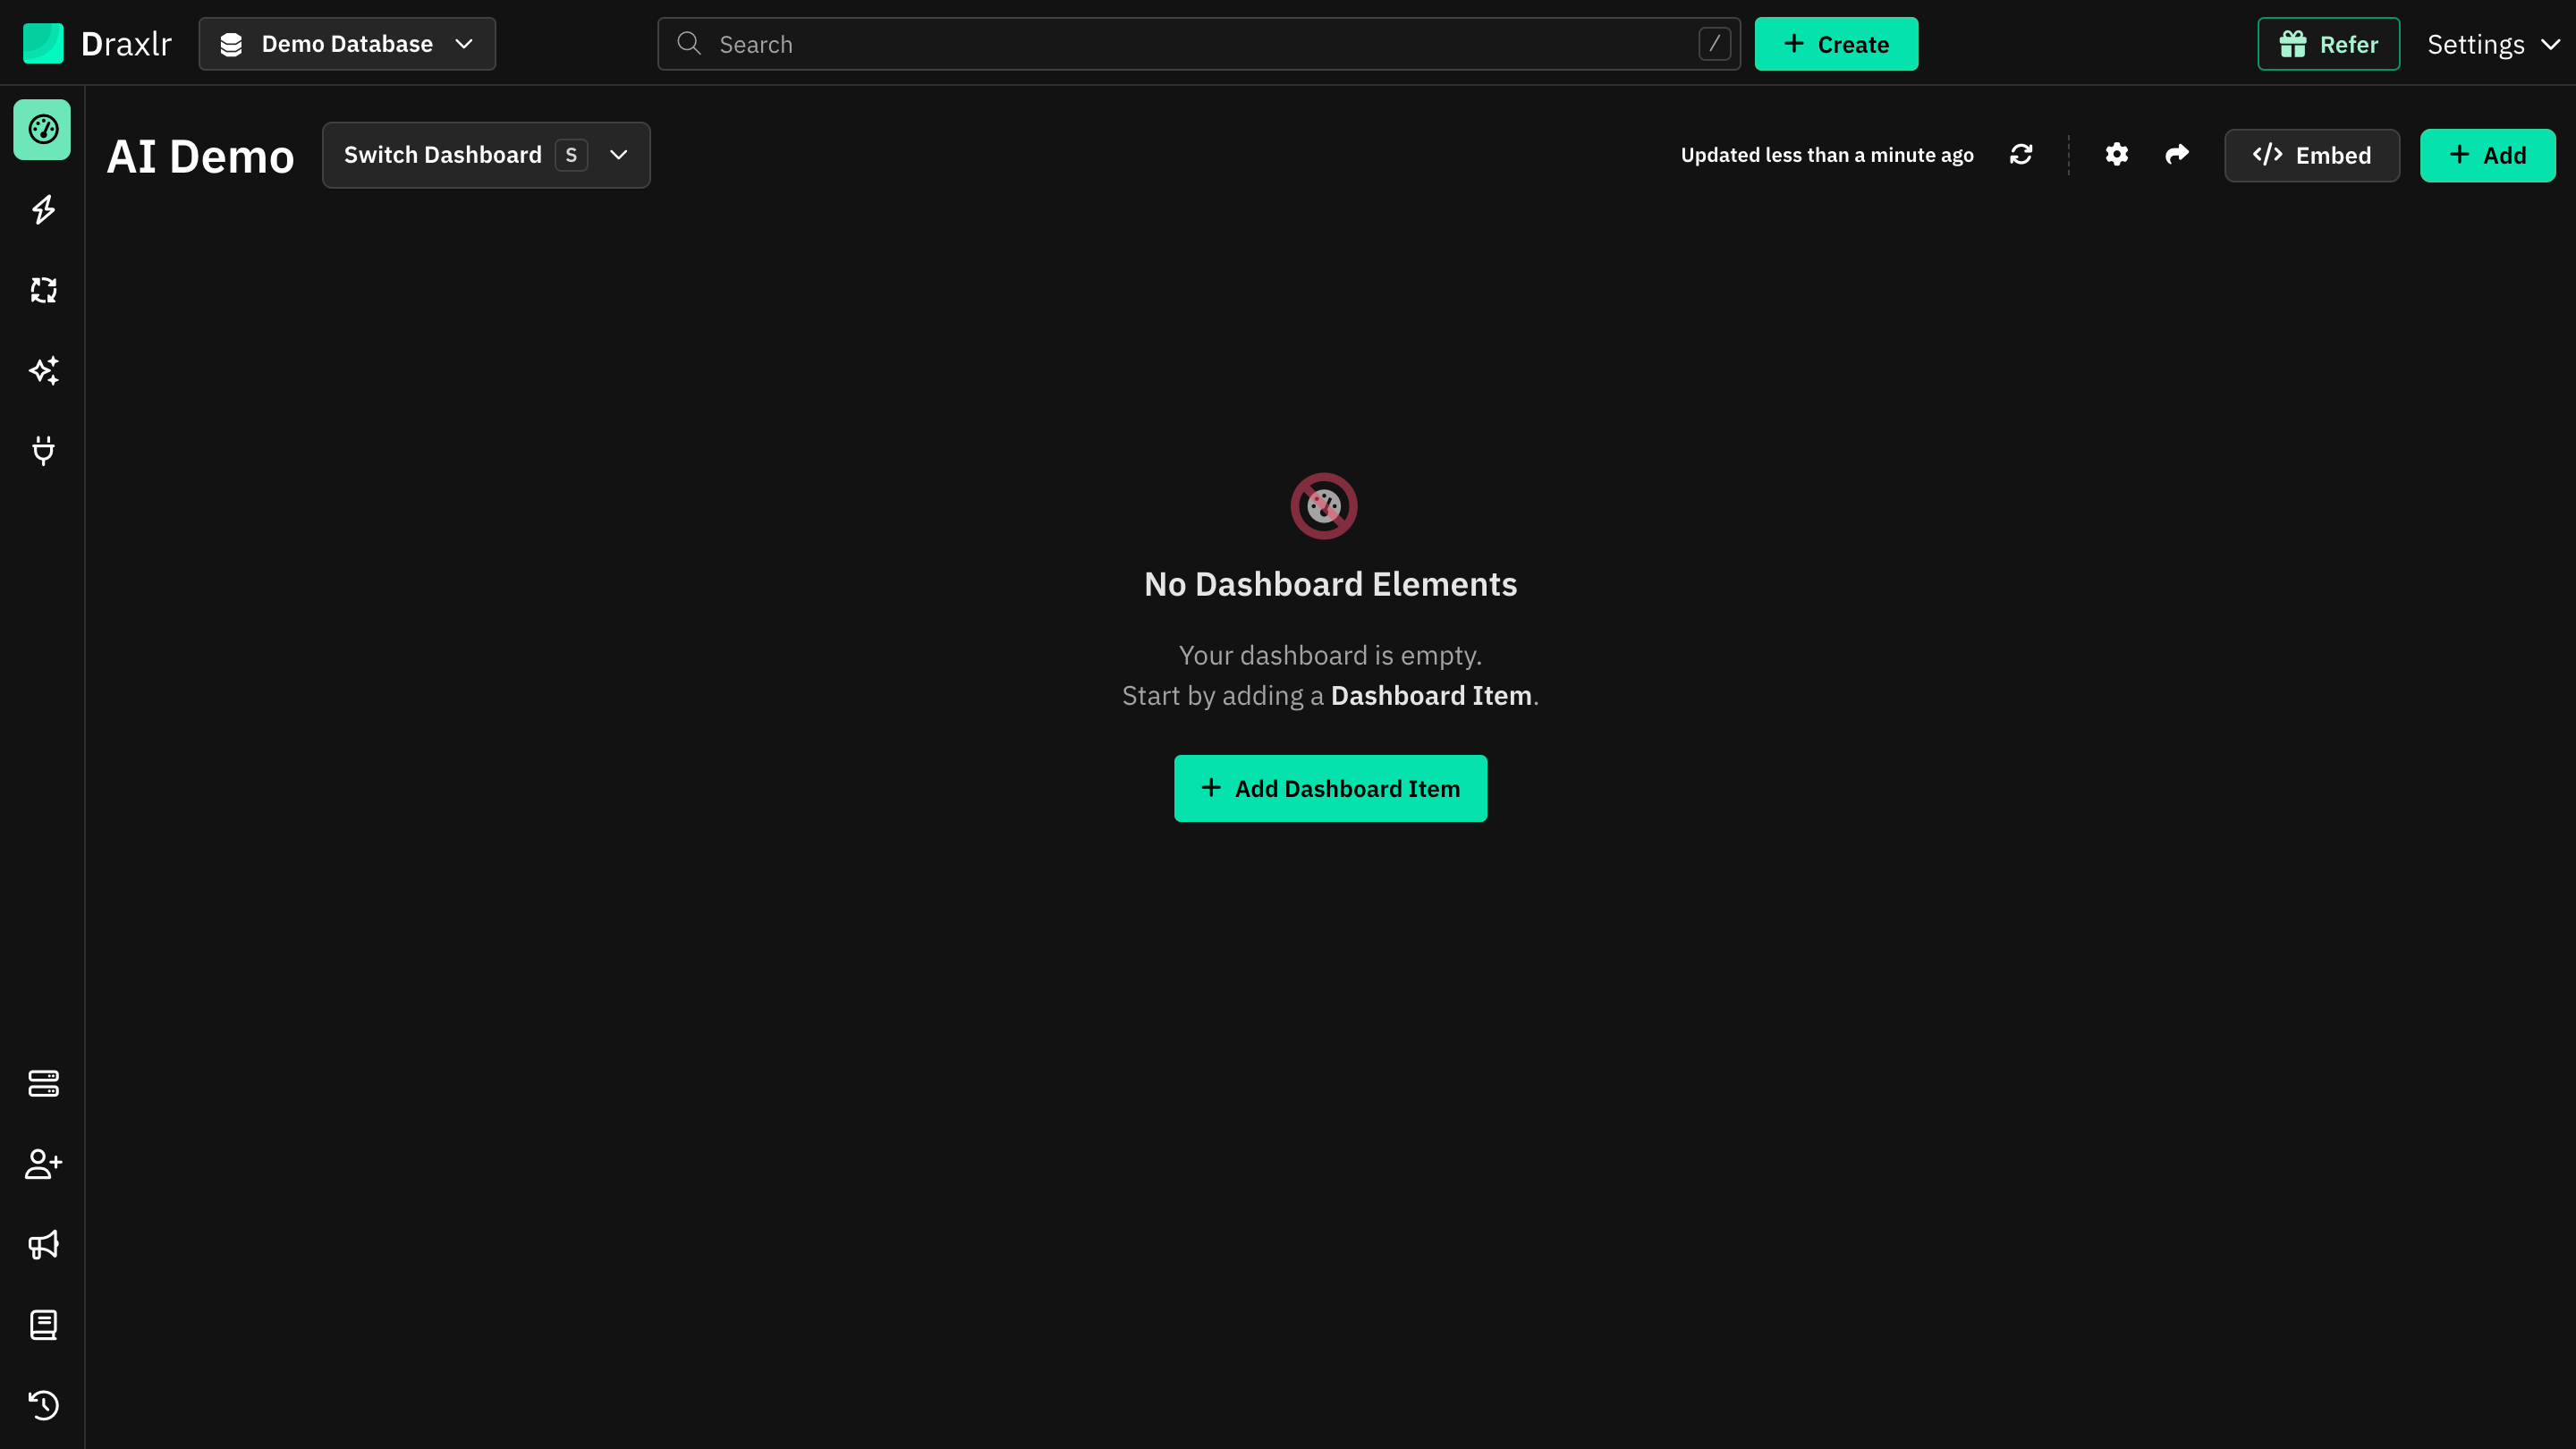
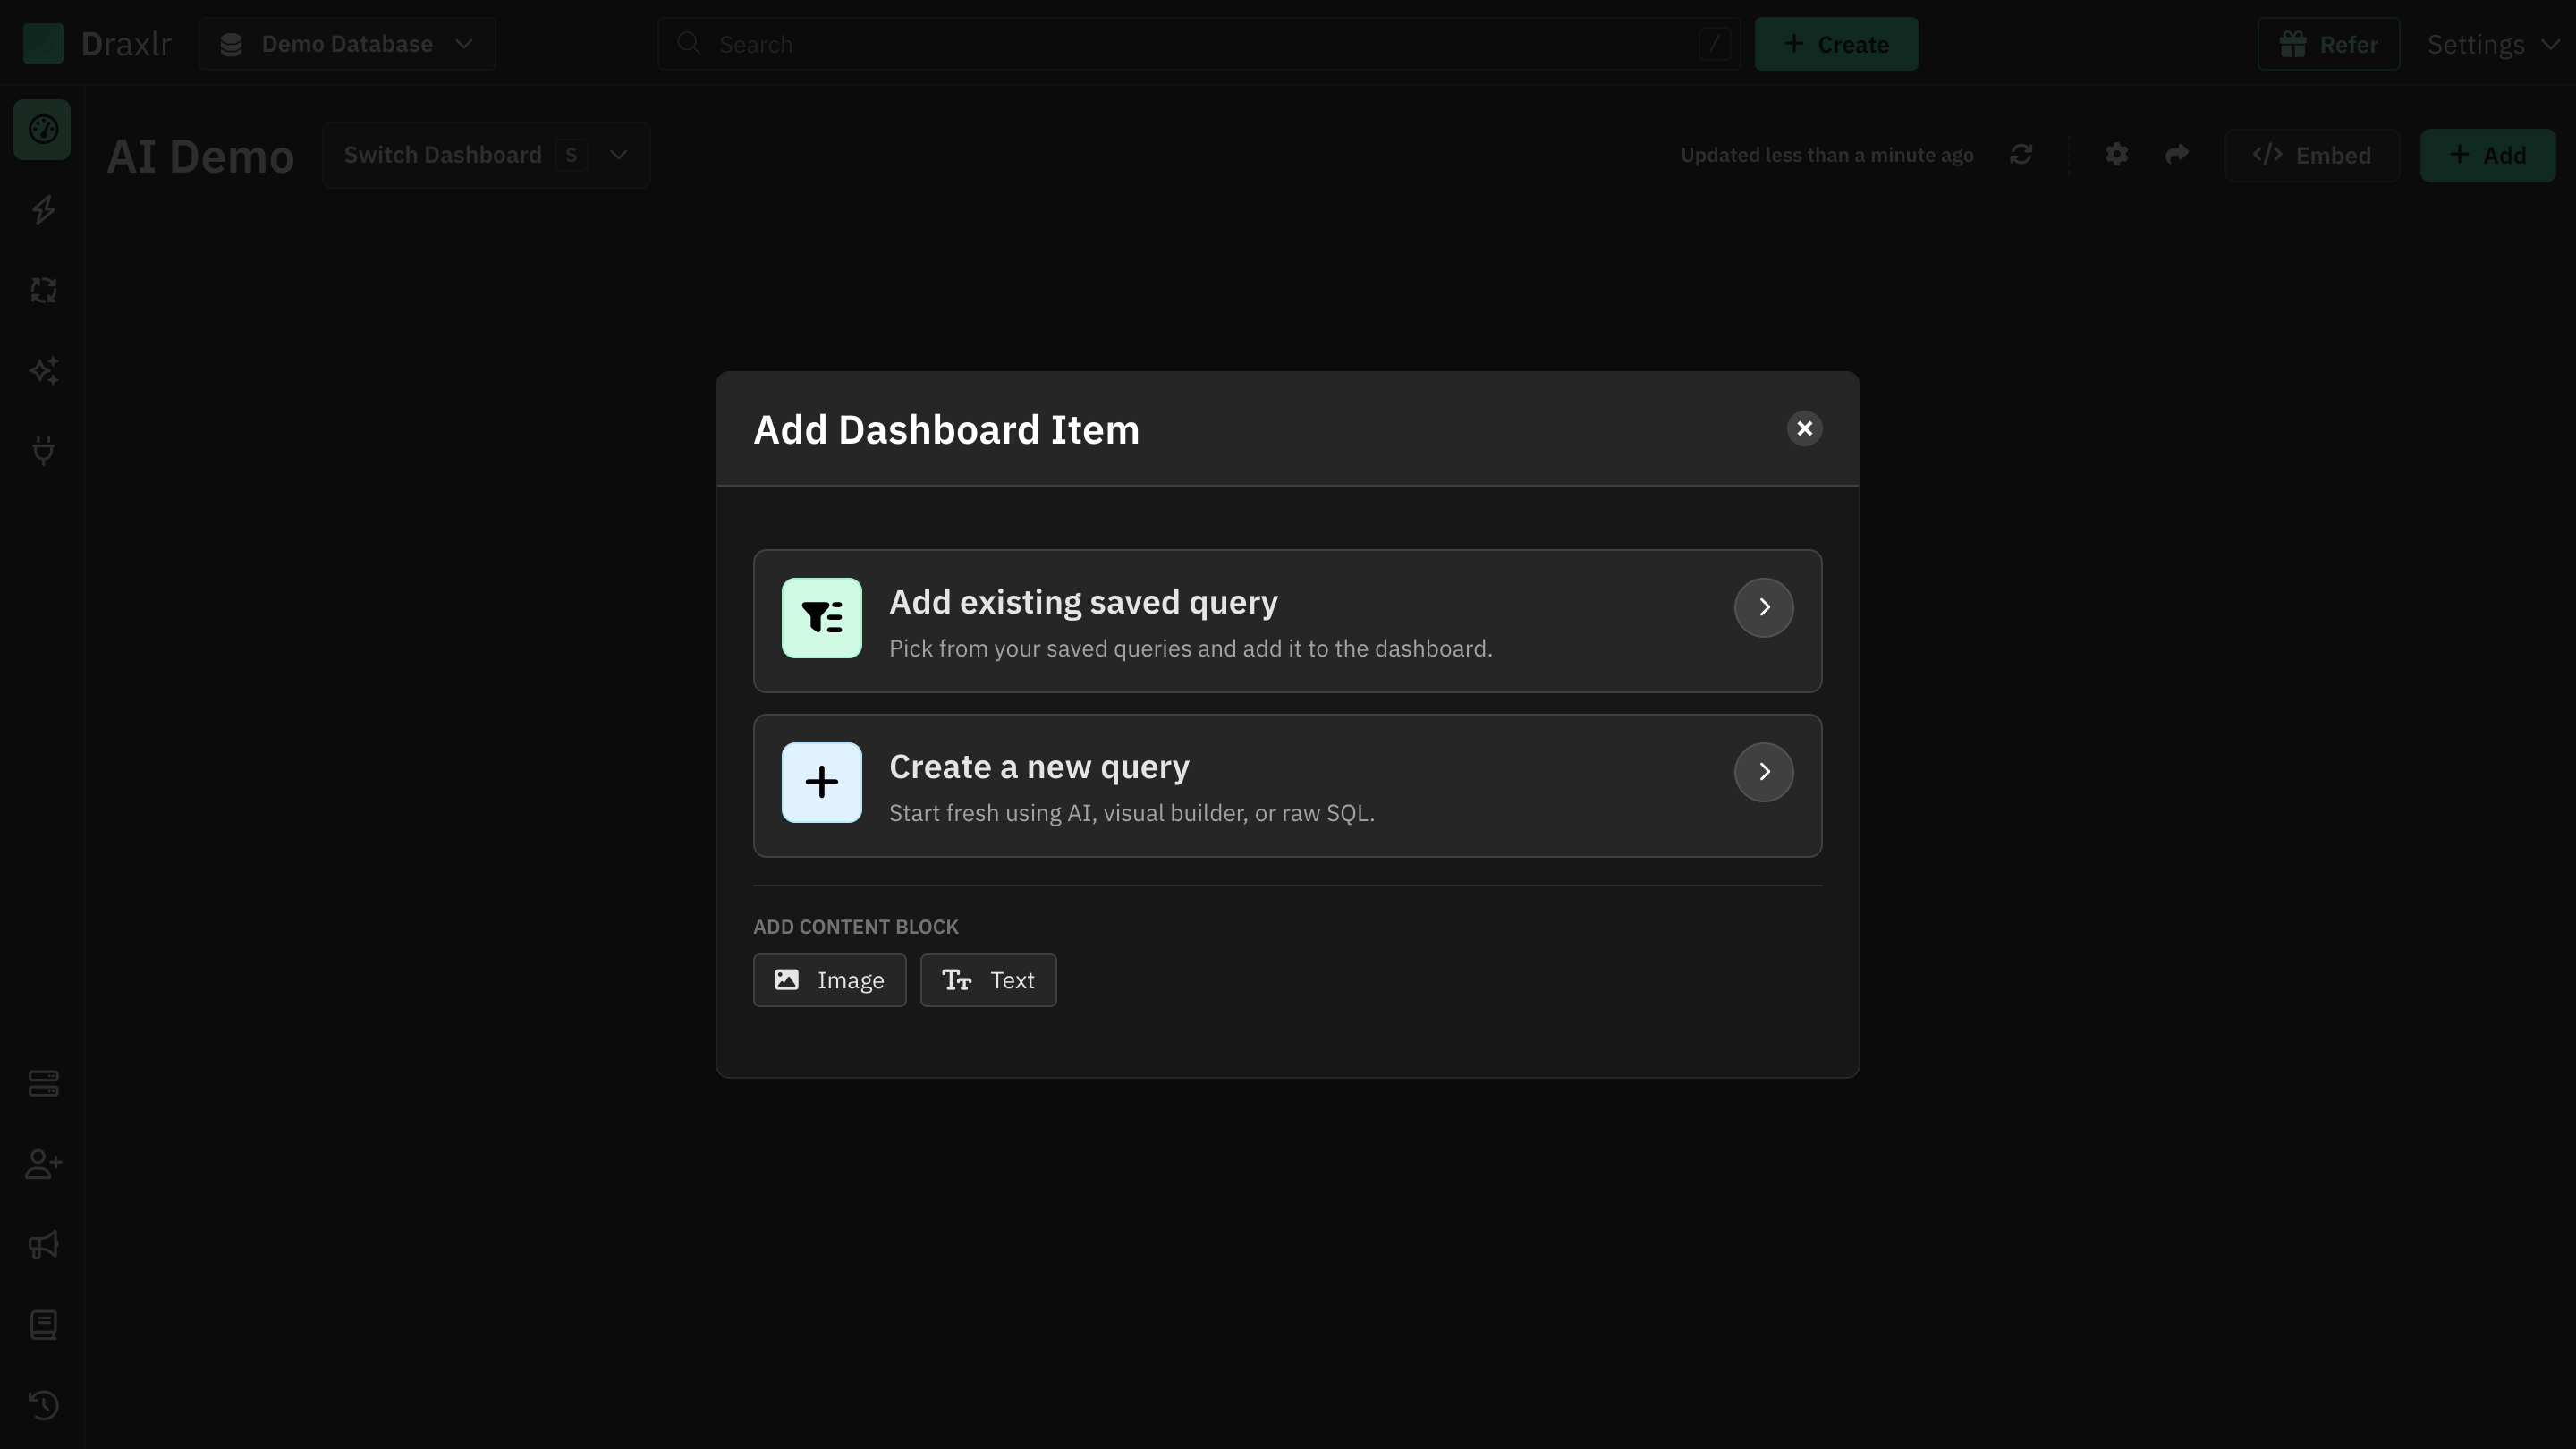
Open the dashboard you want to add to, and click Add.
How to Generate Dashboard Items
- Open the dashboard you want to add items to.
- Click Add at the top right, or Add Dashboard Item on an empty dashboard.
- Choose Create a new query, then AI Assistant.
- In What should we analyze today?, describe what you want to see. For example:
- "Show total orders, monthly order count, and the top 5 countries by orders"
- "Revenue this year by month and by product category"
- "New customers per week and the customers with the most orders"
- Click Generate Dashboard Items, or press Ctrl + Enter (Cmd + Enter on Mac).
Draxlr AI creates one item per number or chart you asked for and adds them to the dashboard. The new items are highlighted for a moment so you can find them.
Good to Know
- Items are added straight to the dashboard you're on. Remove any you don't need from the item's menu.
- Generating items uses AI credits from your plan. The remaining credits are shown below the prompt.
- To change an item later, open its menu and choose Edit with AI, then describe the change. See Draxlr AI.
- To build a whole new dashboard from one prompt, ask Draxlr AI instead.