Visualization > Computed Card
Show a single number from a Draxlr query on a card, with a trend and change since yesterday, a progress bar toward a goal, or a gauge with colored ranges.
A Computed Card shows one number, such as total orders or revenue this month. You can add a trend line with the change since yesterday, a progress bar toward a goal, or show it as a gauge.
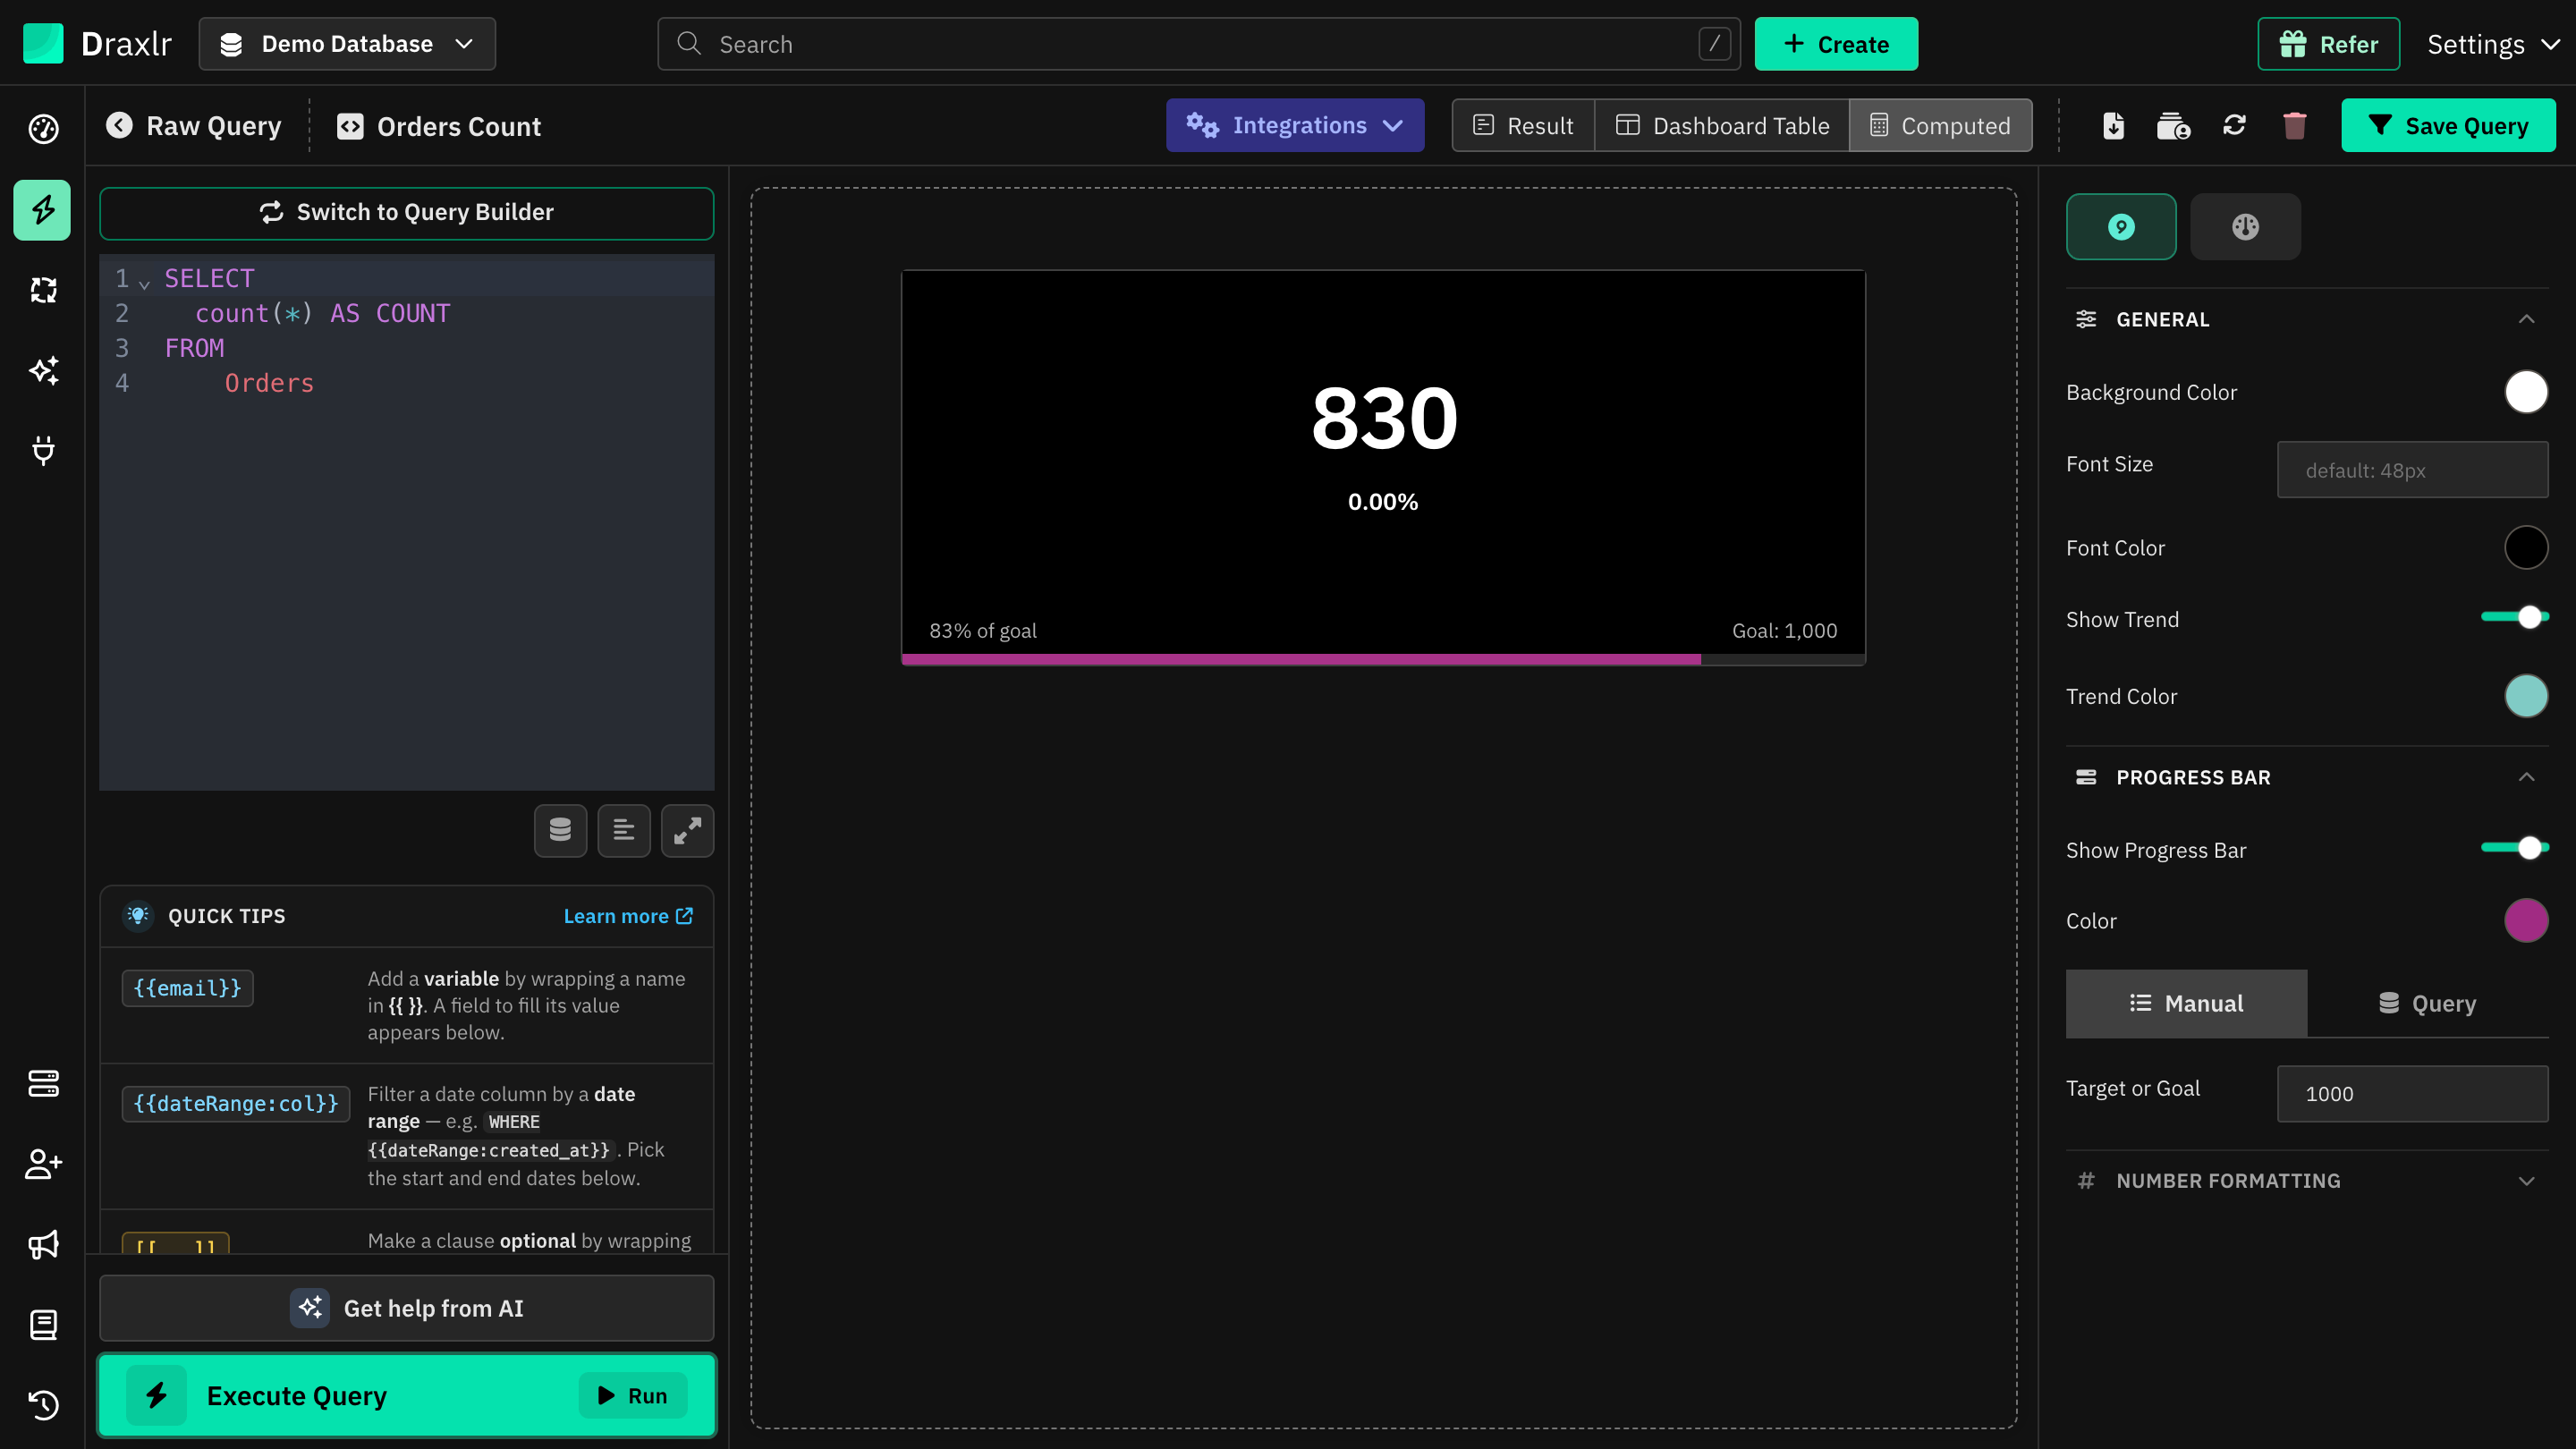
To use it, run a query that returns a single value, such as SELECT count(*) FROM orders, and click Computed at the top. The button appears only when the result is a single value, and it replaces Pivot Table and Graph. The settings panel opens on the right.
Card type
For number values, pick a card type at the top of the panel:
- Standard: the number, with an optional trend and progress bar.
- Gauge: a half-circle gauge with a needle and colored ranges.
Dates, true/false values and text always use Standard.
Standard card
General
| Setting | What it does |
|---|---|
| Background Color | The card's background. |
| Font Size | The largest size for the number. The default is 48px, and the number shrinks to fit the card. |
| Font Color | The number's color. |
| Show Trend | Adds a line of the last 30 days and the change since yesterday. See Trend. |
| Trend Color | The trend line's color. |
Progress Bar
Turn on Show Progress Bar to show progress toward a goal under the number, with N% of goal on the left and Goal: X on the right. Pick the bar's Color, then set the goal:
- Manual: type a number in Target or Goal.
- Query: pick a saved query that returns a single value in Target Query. Draxlr runs it once and uses the result as the goal, shown as Target: N. To update the goal later, pick the query again.
The bar stops at 100%, and is empty for negative values.
Trend
Show Trend uses the card's daily history, which Draxlr collects each day:
- Trend line: the last 30 days, shown once each of the last 7 days has a value. Hover over it to see each day's value.
- Change: the percentage change since yesterday, with a green up arrow or a red down arrow. Without a trend line, it compares with the earliest day that has data, such as last 5 days.
Until there's enough history, the card says The trend appears once daily history is collected. On dashboards, the trend is hidden while dashboard filters are applied or the card's variables are changed.
Gauge
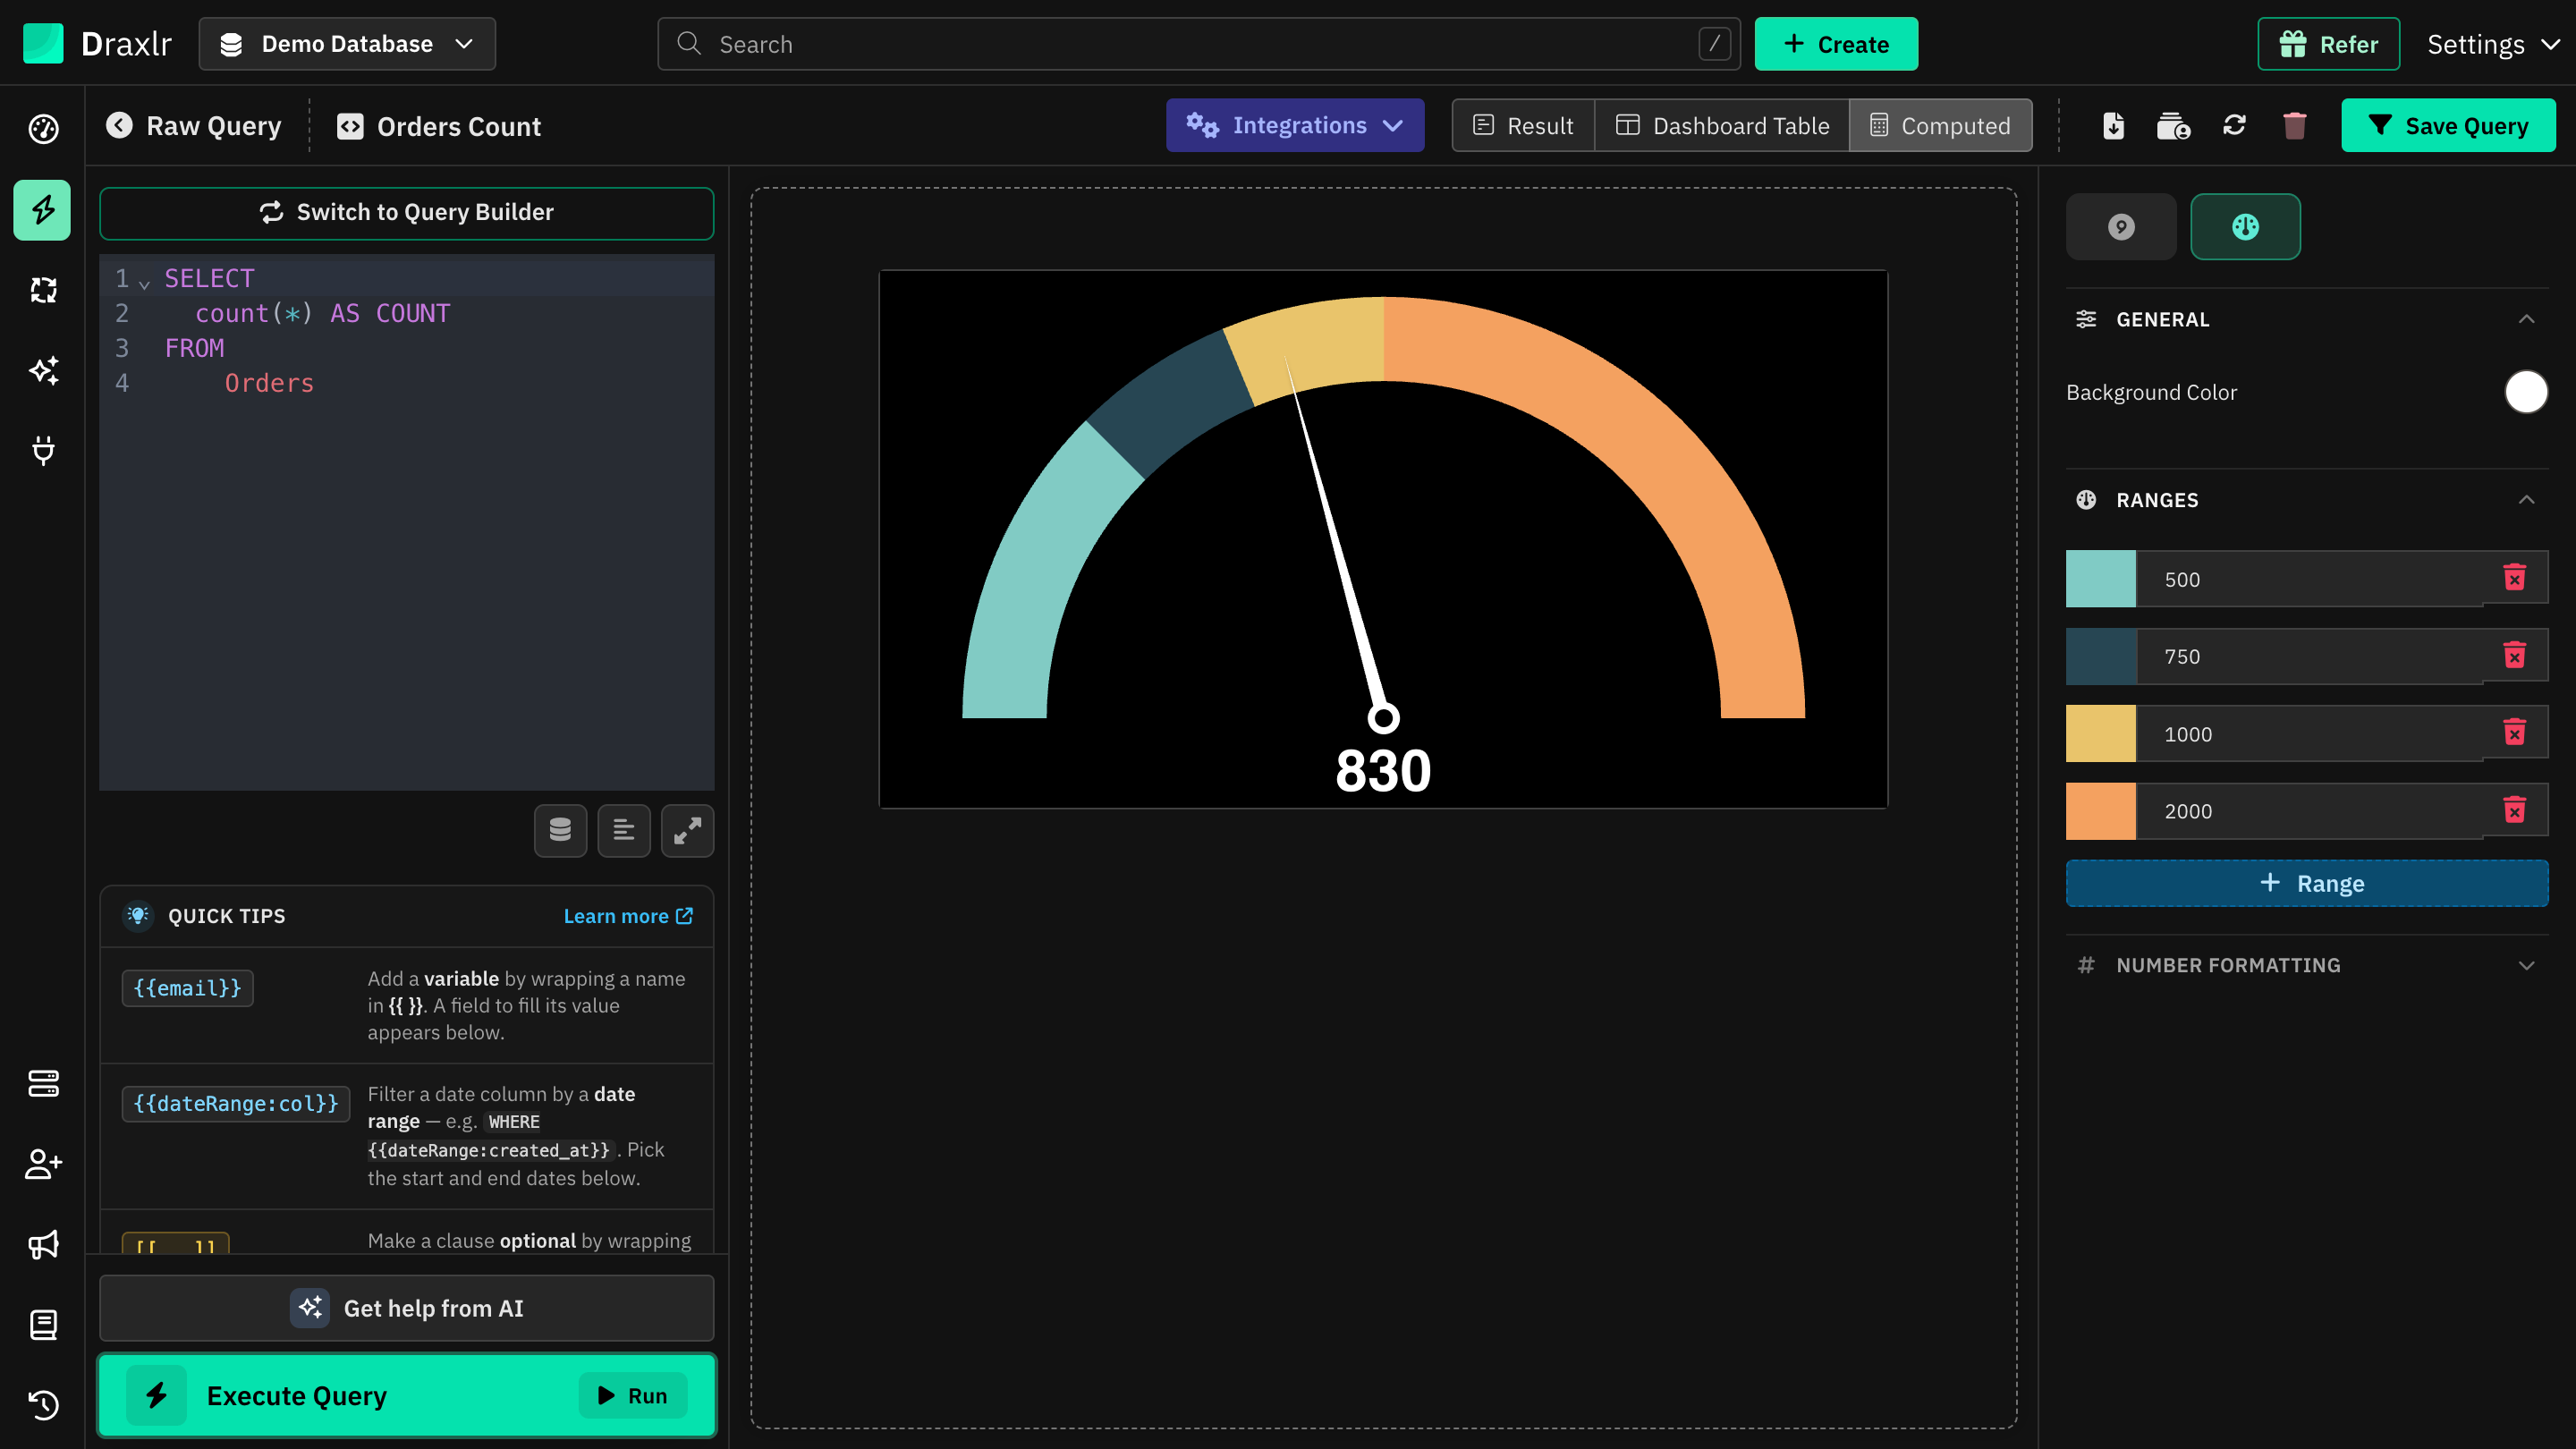
The gauge starts at 0. Each range is a colored band that ends at its value, and the needle points to the card's value, which is shown below it.
- Under Ranges, set each range's Value and click its color square to change the color.
- Click + Range to add a range, and the trash icon to remove one.
- Every range needs a value greater than 0. Otherwise the card shows Please select all the fields. and the query can't be saved.
The gauge has Background Color and number formatting, but no font settings or trend.
Formatting
The last section changes with the value's type.
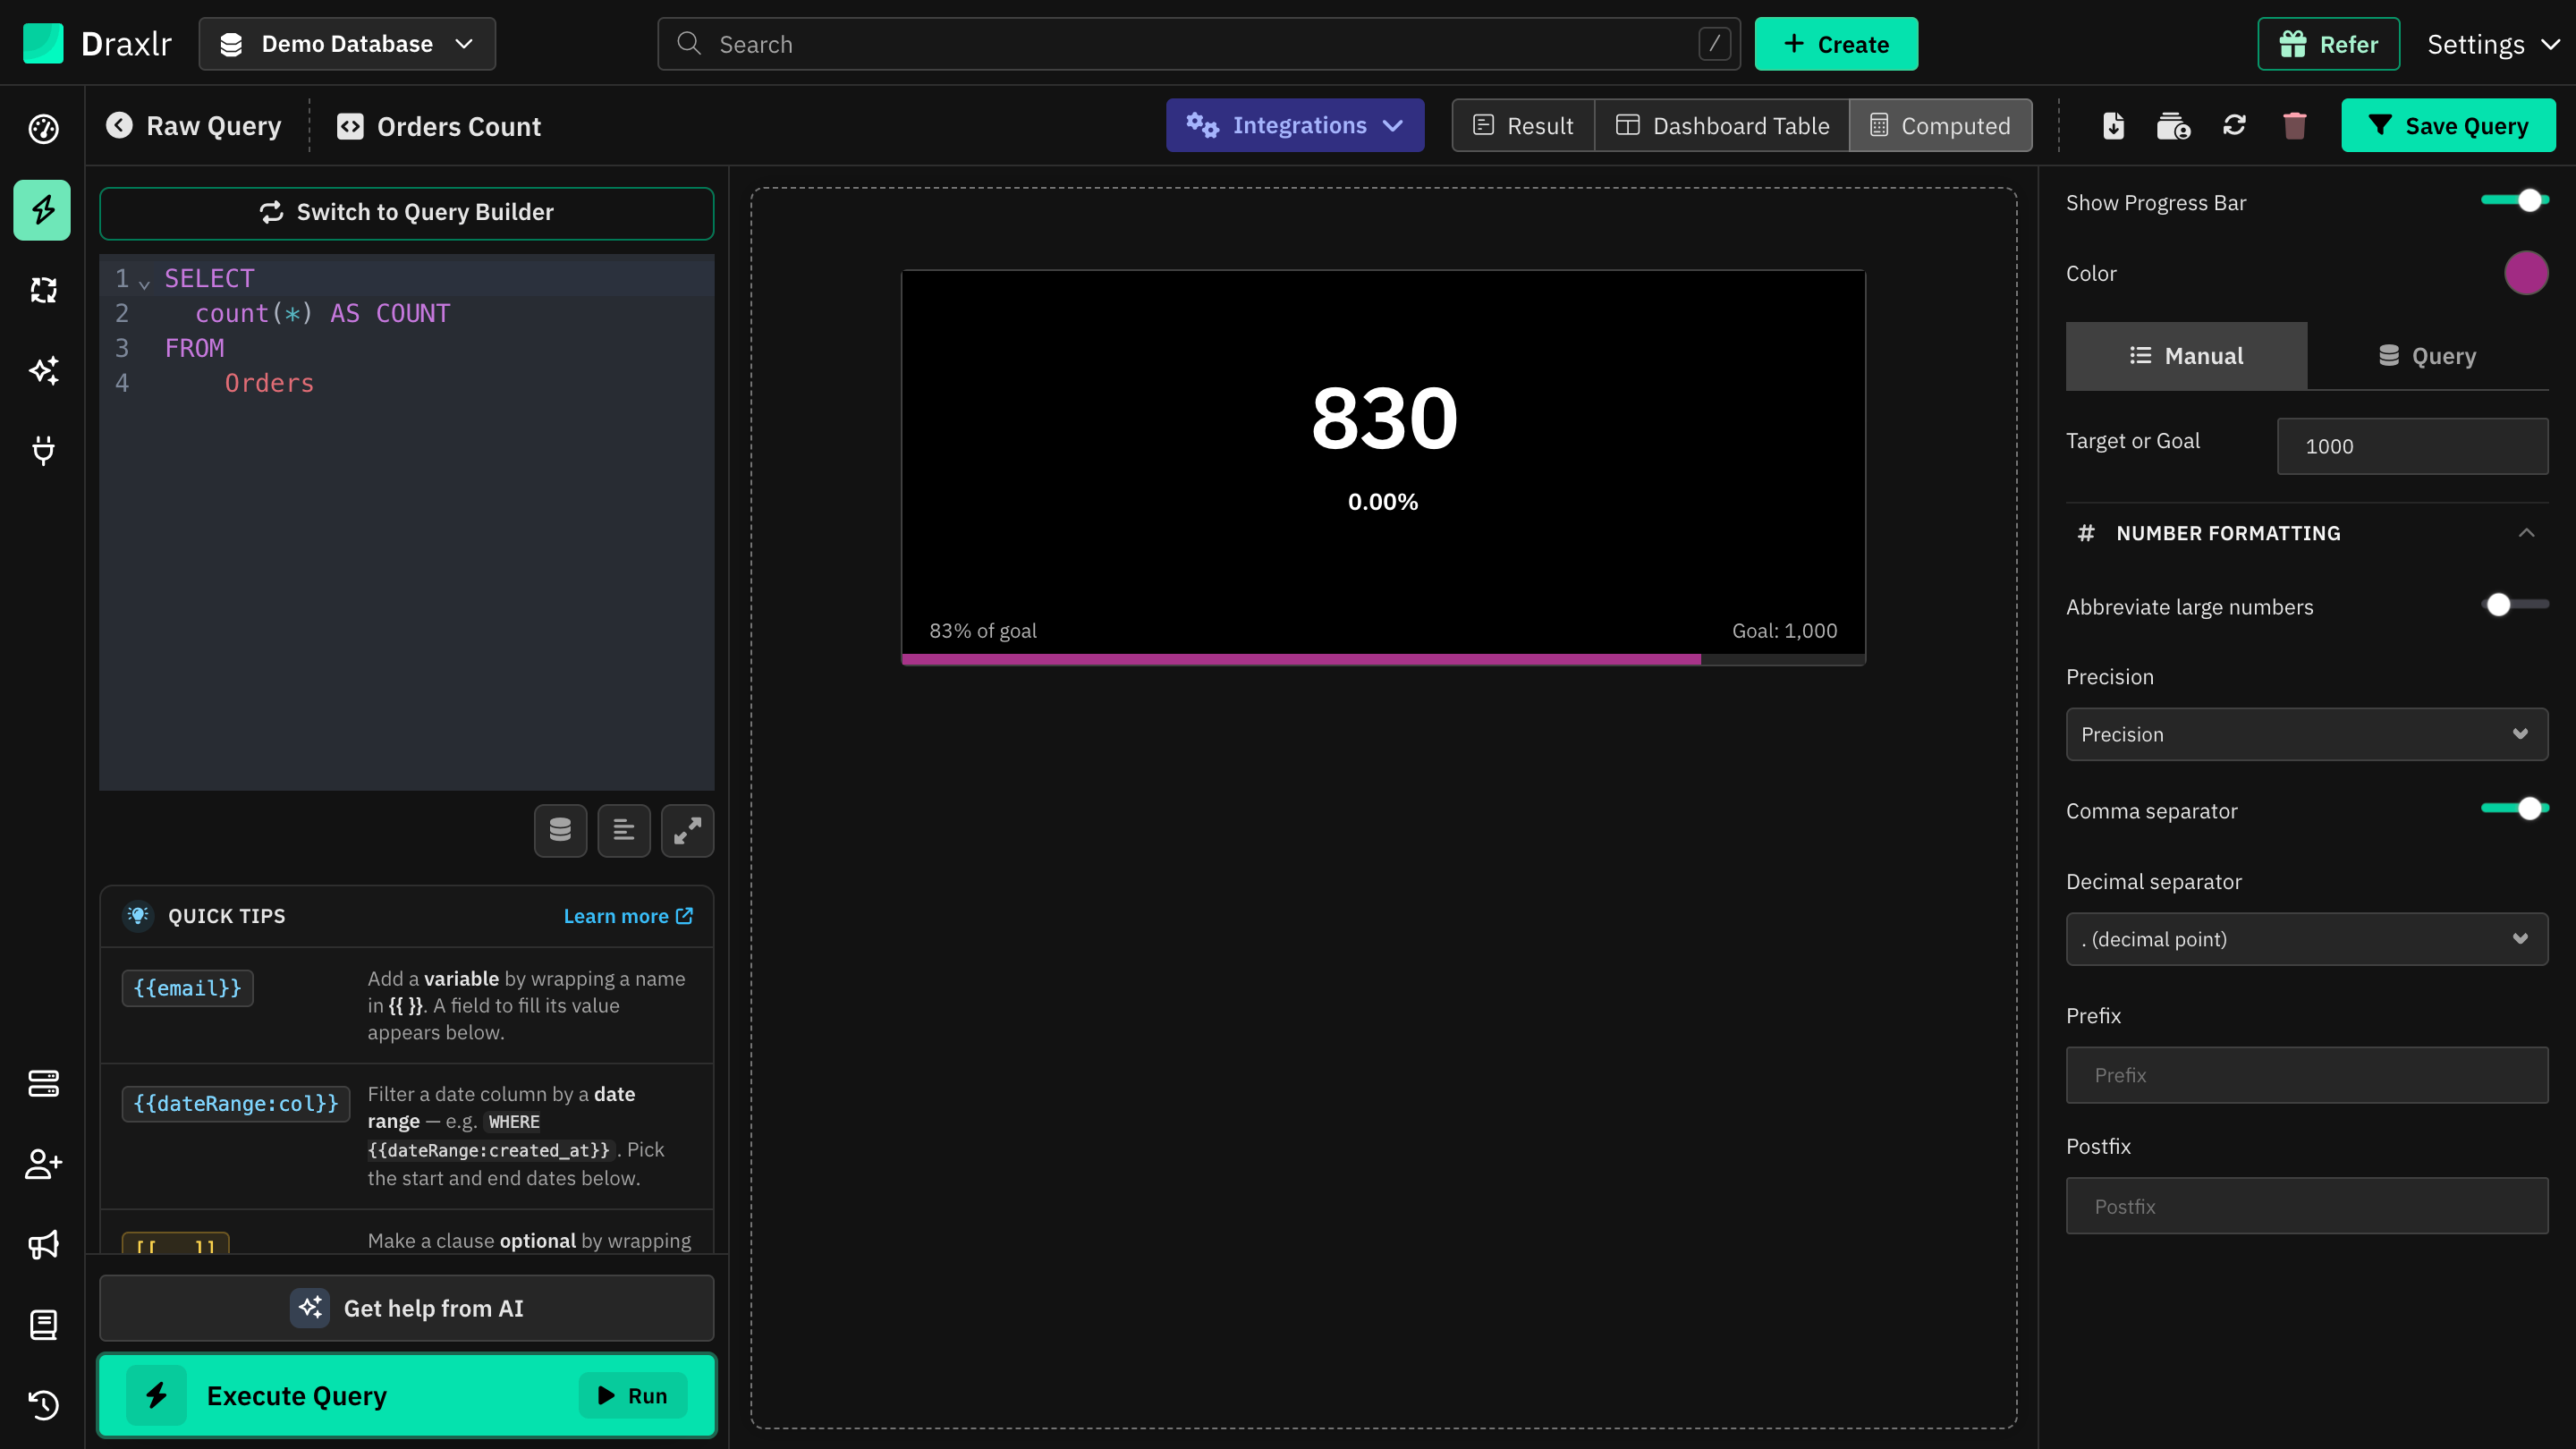
Numbers (Number Formatting)
| Setting | What it does |
|---|---|
| Abbreviate large numbers | Shows large numbers in short form, such as 1.2K or 3.4M. |
| Precision | The number of decimal places, from 1 (no decimals) to 0.000001. Leave it empty to keep the value's own decimals. |
| Comma separator | Adds thousands separators. On by default. |
| Decimal separator | . (decimal point) or , (comma). Shown when Comma separator is on. |
Dates (Date Formatting)
| Setting | What it does |
|---|---|
| Date Format | Such as Mmm dd, yyyy, dd/mm/yyyy or mm-dd-yy. Leave it empty to show the value as it is. |
| Include Time | Adds the time, with a Time Format of 12 hour system or 24 hour system. |
True/false values (Formatting): Format shows them as true/false or Yes/No.
For every type, Prefix and Postfix add text right before or after the value, with no space, such as $ or %.
Things to know
- Which value is shown: the card shows the last column of the first row.
- See the rows behind it: click the number to open the data behind it. Click Back to previous Query to return to the card.
- Saving: on a saved query, click Save Query to keep your changes. See How settings are saved.
- On dashboards: the element shows the card with these settings. A dashboard or embed background color replaces the card's Background Color.
- Goal label: Goal: X doesn't include the prefix or postfix.