Browse Data > Visualization
Show a Draxlr query result as a formatted table, a pivot table, a chart or a single-number card, and keep the settings when you add the query to a dashboard.
After you run a query in Browse Data, choose how to show the result with the buttons at the top of the page. Each one opens its own settings on the right, and the settings are saved with the query, so a dashboard shows it the same way.
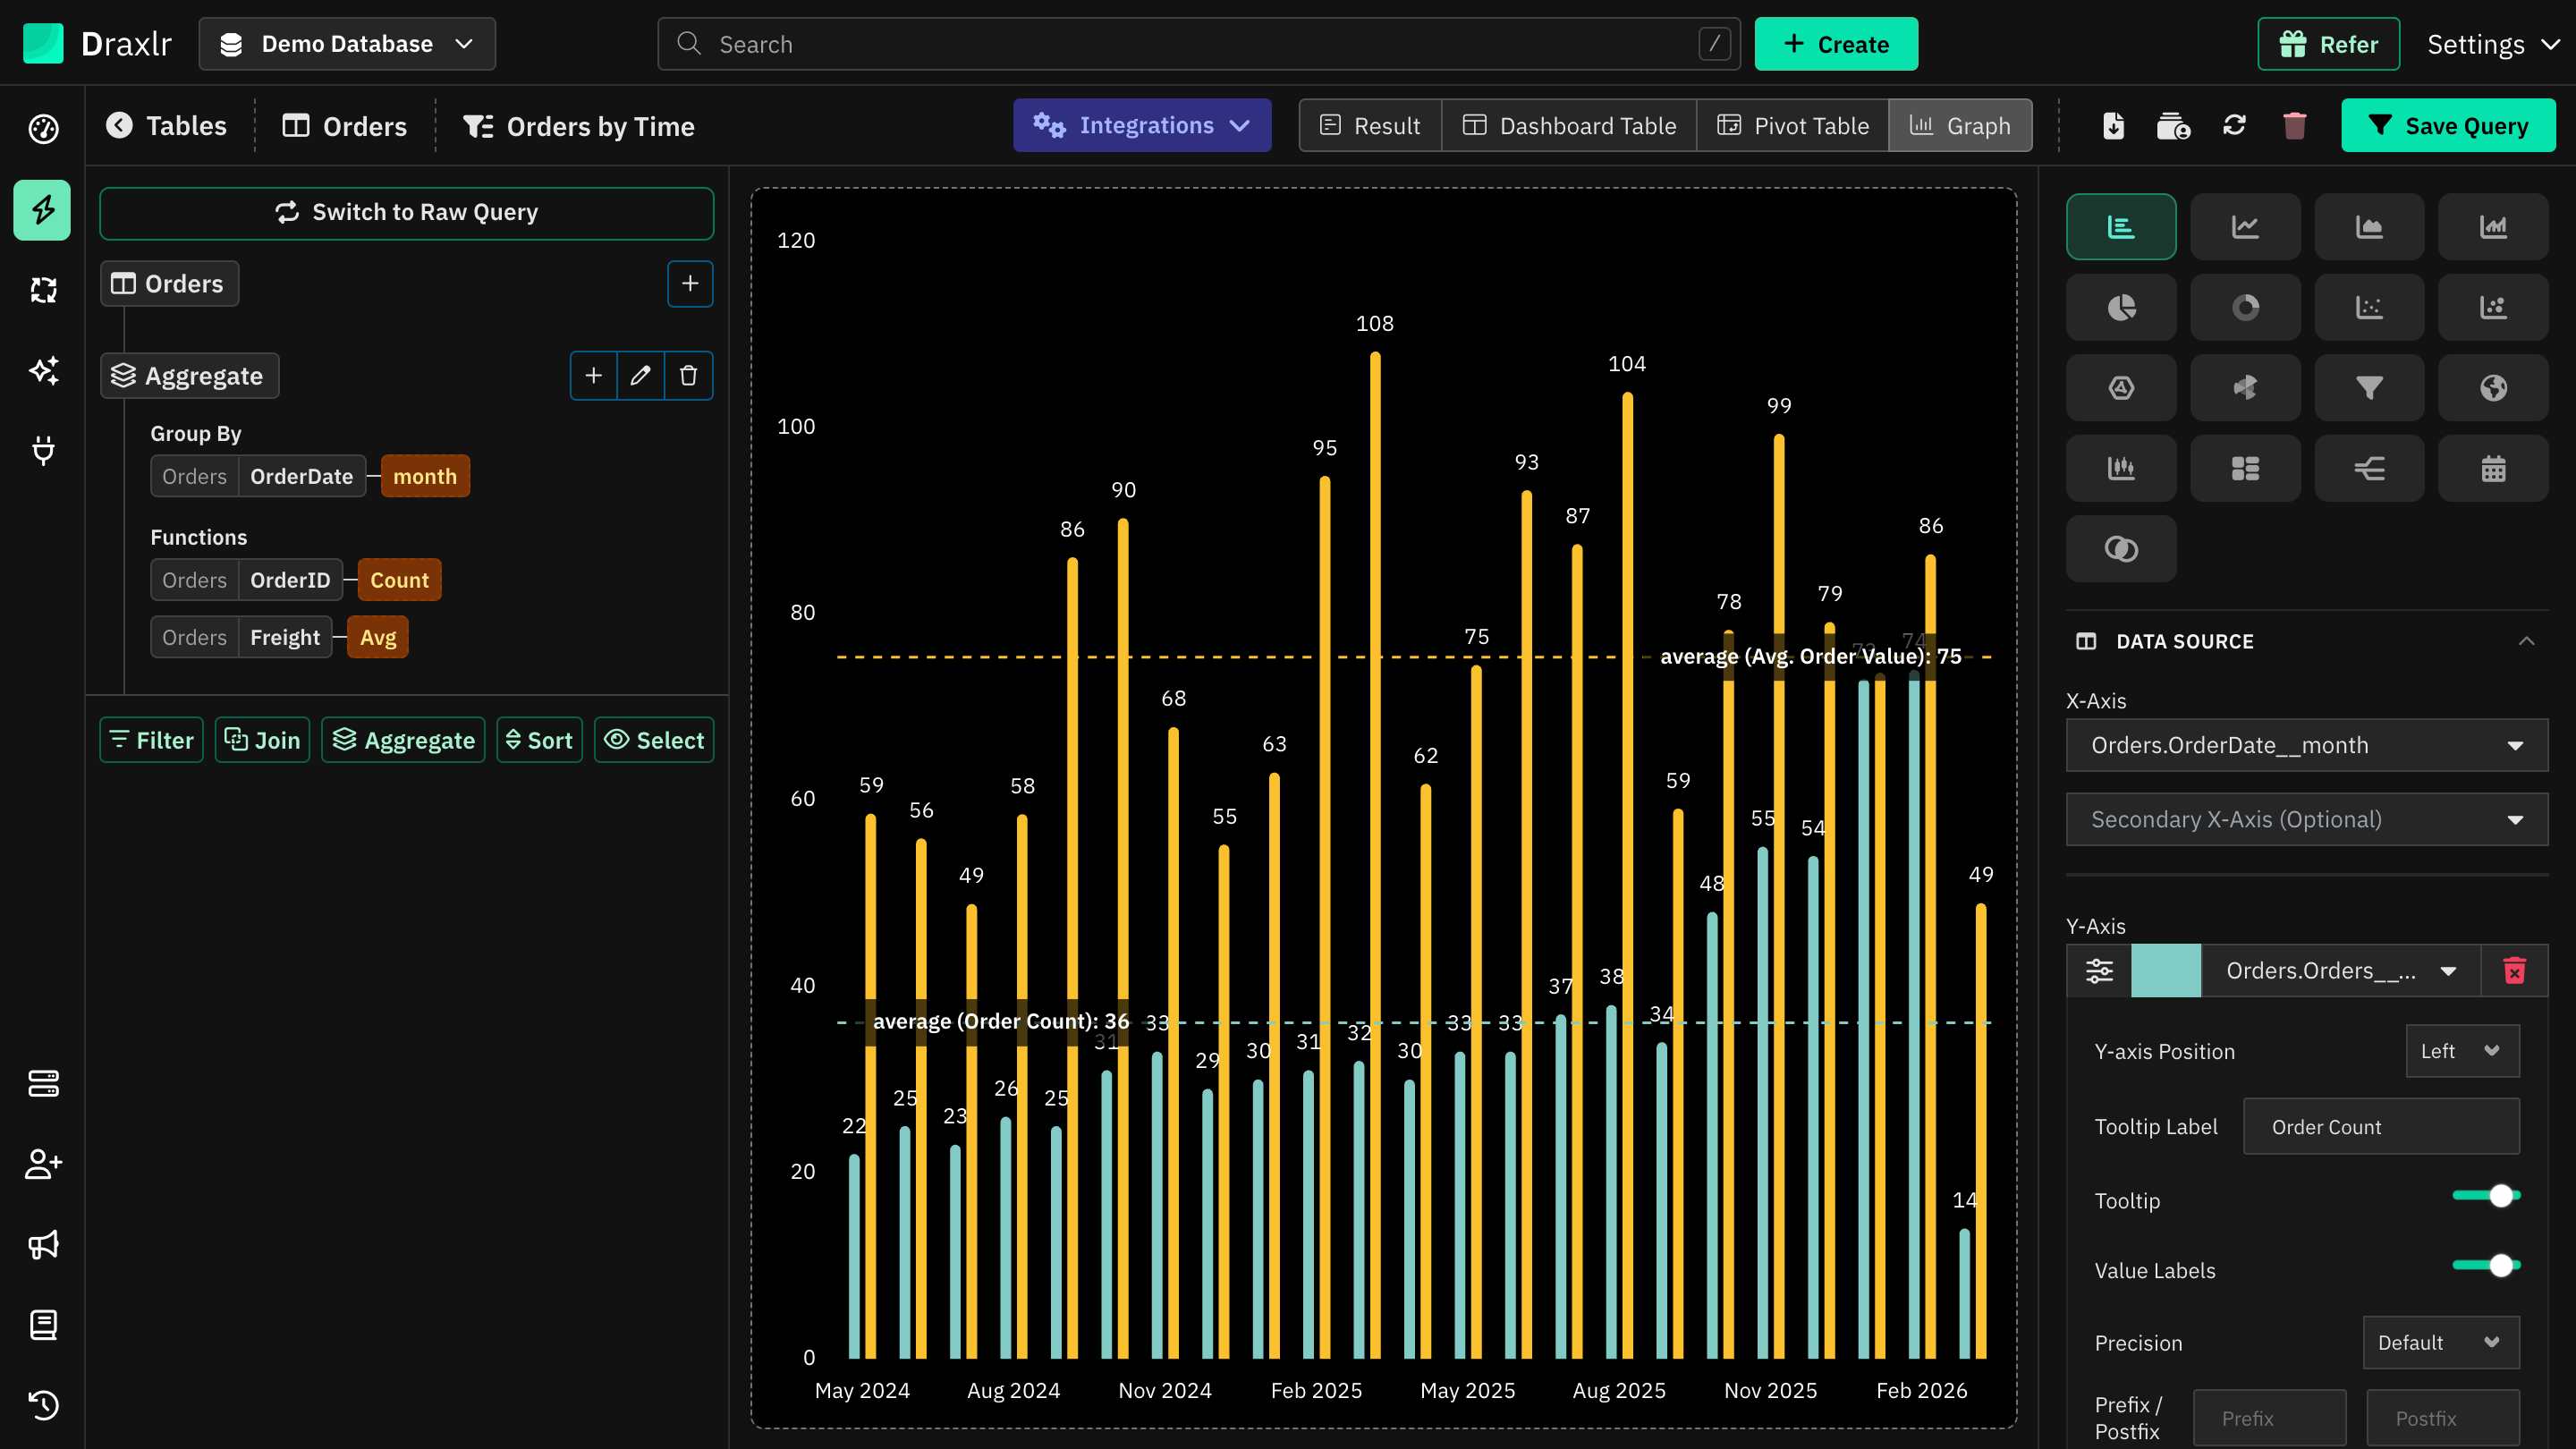
Visualization types
| Button | Shows the result as | Available when |
|---|---|---|
| Result | A plain table with the raw values. It has no settings. | The query returns rows. |
| Dashboard Table | A formatted table: rename, reorder and hide columns, format numbers and dates, add colors, badges, progress bars and links. See Dashboard Table. | The query returns rows. |
| Pivot Table | A table that summarizes values by row and column groups, with totals. See Pivot. | The result has more than one value. |
| Graph | One of 17 chart types, such as bar, line, pie, map or calendar. See Graph. | The result has more than one value. |
| Computed | A single number on a card, with an optional trend, progress bar or gauge. See Computed Card. | The result is a single value, such as a count or a total. |
On narrow windows the buttons show only icons. Hover over an icon to see its name.
Change the settings
Run a query
Build a query with the Query Builder or Raw SQL, or open a saved query.
Choose a visualization
Click Dashboard Table, Pivot Table, Graph or Computed at the top. The settings panel opens on the right once the query has run.
Adjust the settings
Changes show in the preview right away.
Save the query
On a saved query, click Save Query to keep your changes.
How settings are saved
- New query: settings are kept with the query as you change them, and saved when you save the query.
- Saved query: settings are saved only when you click Save Query. Changing only display settings doesn't show the You have unsaved changes in your Query banner, so remember to save before you leave.
On dashboards
When you add a saved query to a dashboard, the element uses the query's saved visualization and settings. To change how it looks, open the query with View / Edit Query in the element's menu, change the settings and click Save Query.
A dashboard's own background color, or an embed's appearance, can override the visualization's background color.