Visualization > Graph
Show a Draxlr query result as a chart, such as bar, line, area, pie, doughnut, scatter, funnel, treemap, sankey, map, calendar or venn, and customize its axes, colors, labels, legend and formatting.
A Graph shows your query result as a chart. To use it, run a query in Browse Data and click Graph at the top. It's available when the result has more than one value. The settings panel opens on the right, with the chart types at the top.
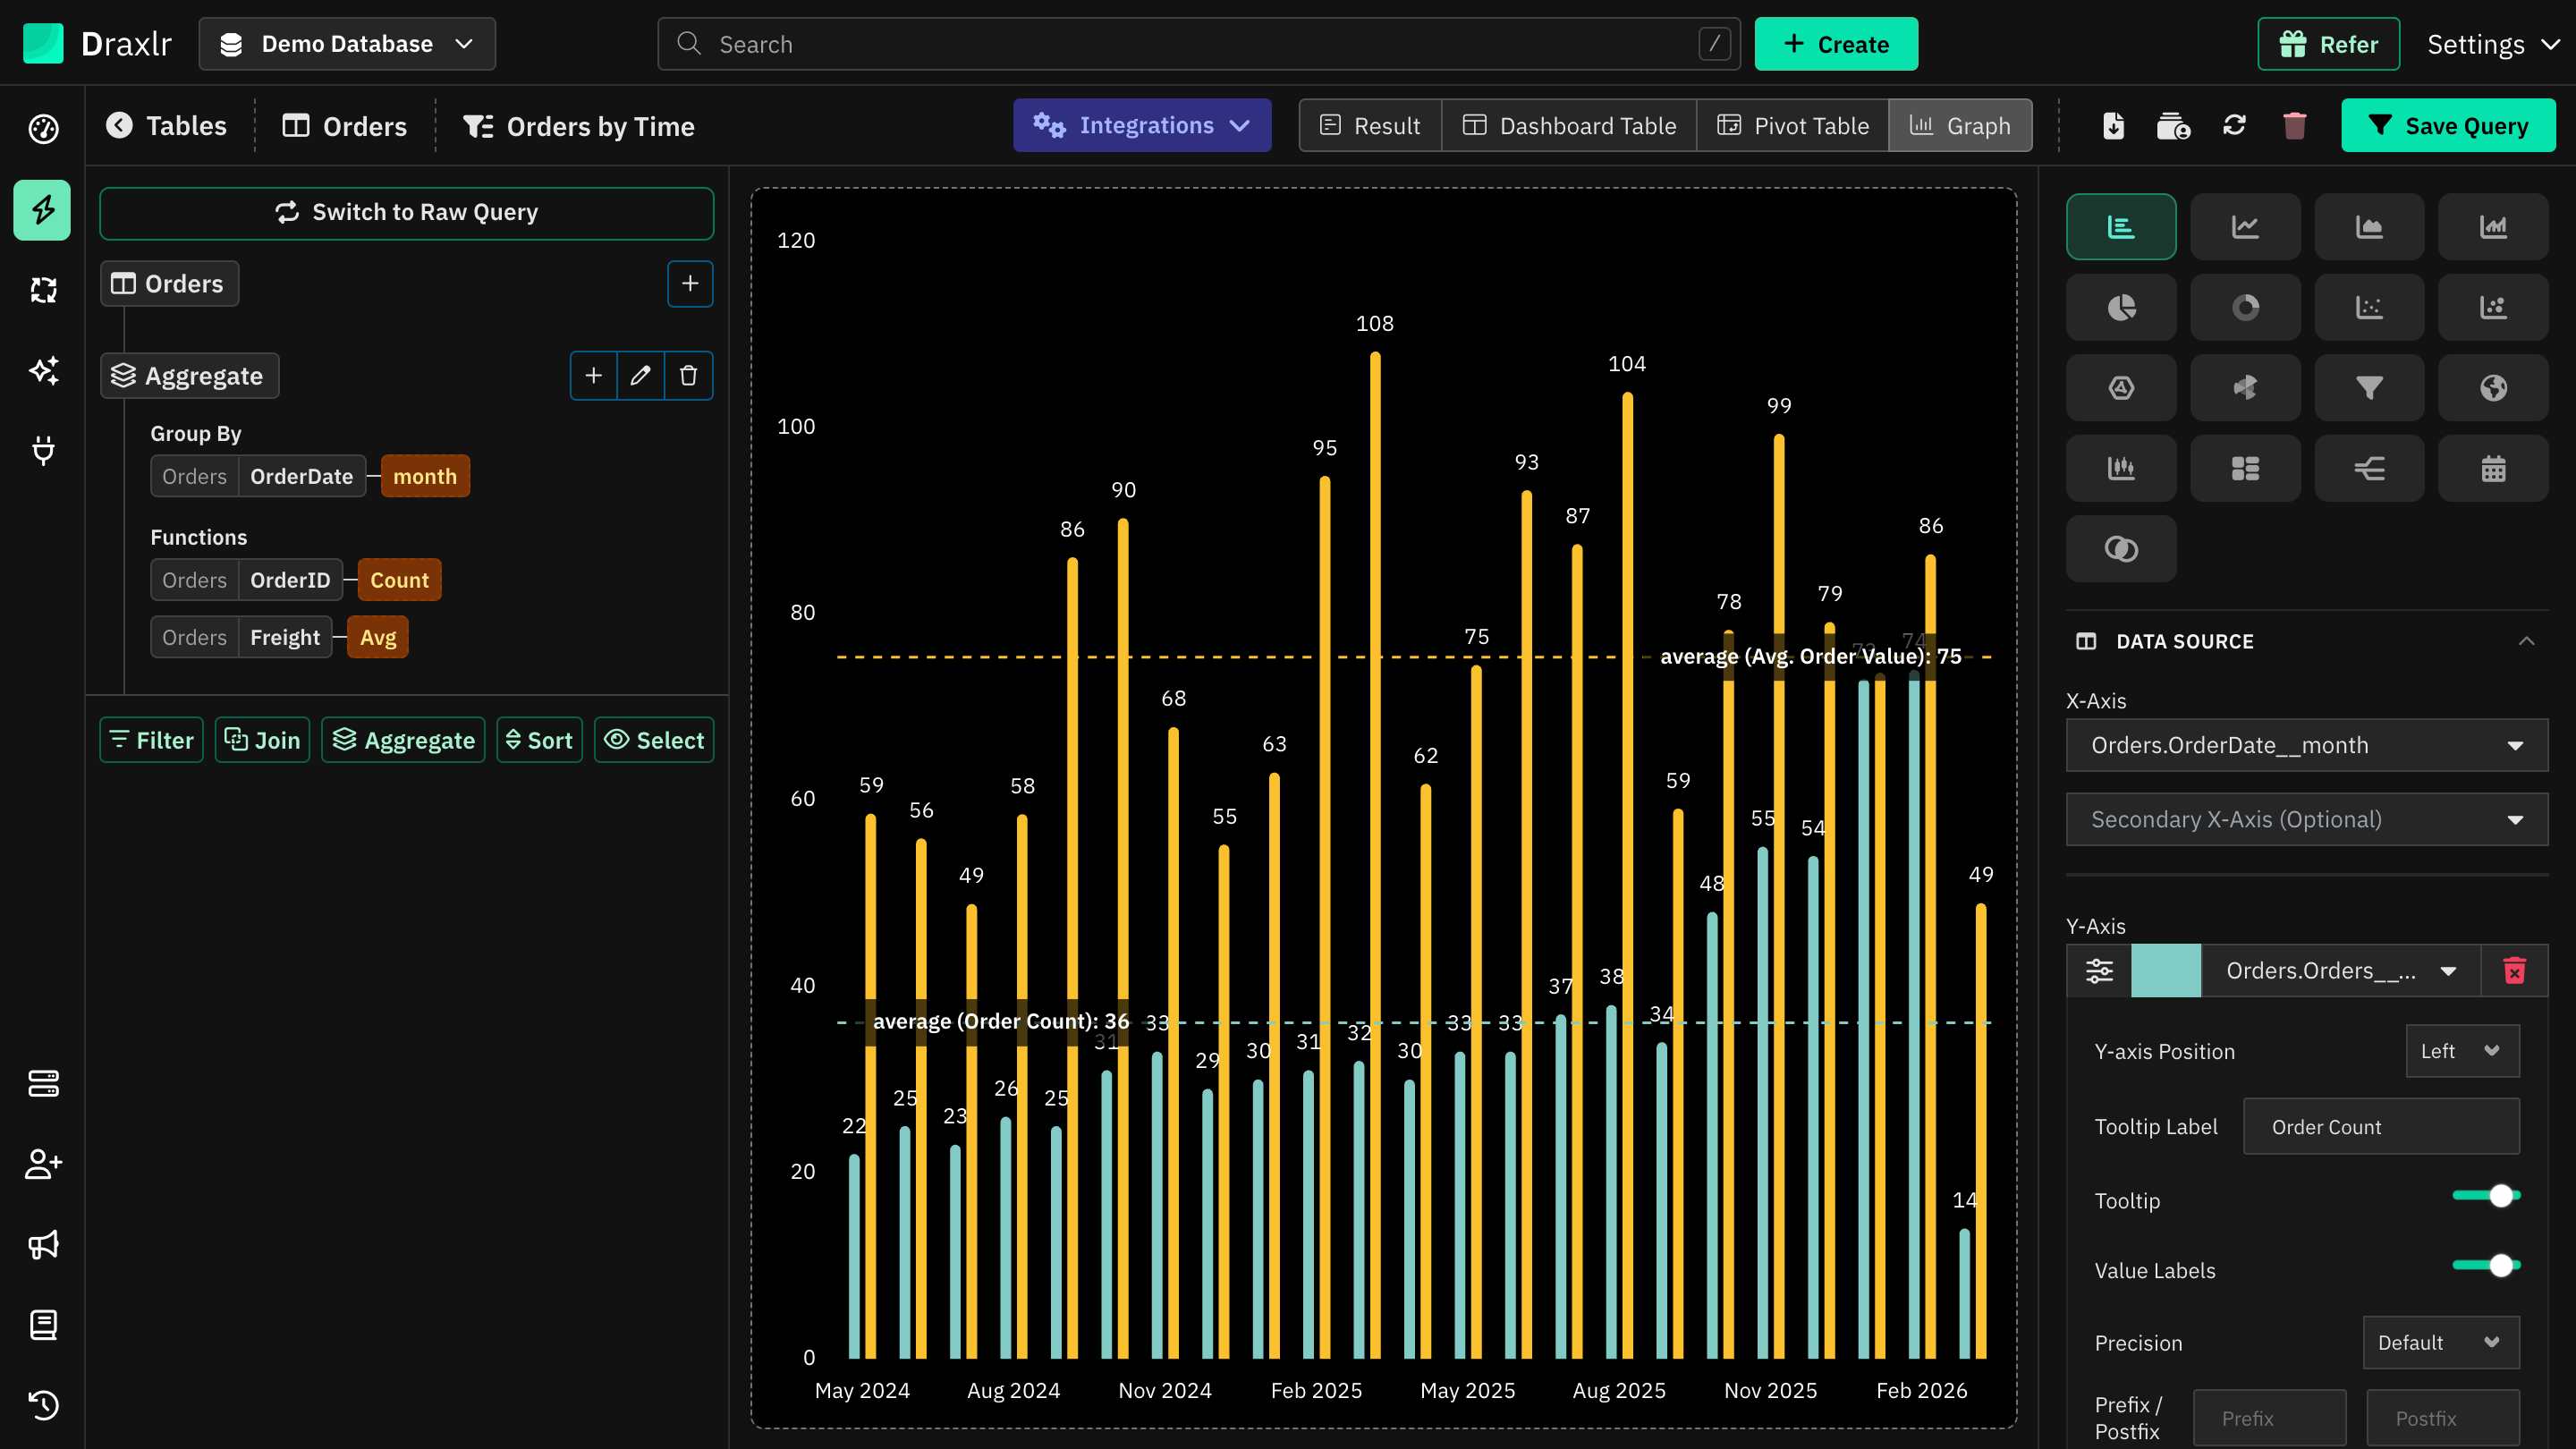
Quick Graph Generator
A chart needs grouped data. If your Query Builder query has no Aggregate step, Draxlr shows the Quick Graph Generator instead:
- Choose the X-Axis column.
- Choose the Y-Axis, such as Count of rows, or Sum of, Average of, Min of or Max of a number column.
- Click Generate Graph. Draxlr adds an Aggregate step, runs the query and draws the chart. Date columns are grouped by month.
Raw SQL queries skip the generator. The chart uses the columns your SQL returns.
Chart types
Click an icon at the top of the panel to change the chart. Hover over an icon to see its name. Bar is the default.
| Chart | Good for | Fields |
|---|---|---|
| Bar | Comparing values across categories or over time | X-Axis, Y-Axis |
| Line | Trends over time | X-Axis, Y-Axis |
| Area | Trends over time, with the area filled | X-Axis, Y-Axis |
| Bar Line | Bars and lines on one chart, such as order count and average order value | X-Axis, Y-Axis |
| Pie, Doughnut | Shares of a total | Label, Value |
| Polar | Comparing categories around a circle | Label, Value |
| Scatter | The relationship between two numbers | X-Axis, Y-Axis, Label (optional) |
| Scatter Bubble | Like Scatter, with a third number for the bubble size | X-Axis, Y-Axis, Radius, Label (optional) |
| Radar | Comparing categories on one measure, around a circle | Theta, Radius |
| Funnel | Steps in a process, such as visits to orders | Label, Value |
| Map | Values by country, region or location | See Map |
| Box And Whiskers | How values are spread | X-Axis, Minimum, q1, Median, q3, Maximum |
| Tree Map | Shares of a total, as rectangles | X-Axis, Y-Axis |
| Sankey | Flows from one stage to another | Source, Target, Flow |
| Calendar | Values on each day | Date, Value |
| Venn | How groups overlap | Sets, Value |
When you pick a chart, Draxlr fills in the fields from your result. Change them under Data Source. For a single number, such as a total, use a Computed Card, which also has a gauge.
Bar, line, area and bar line
These charts share the same settings. Sections start closed, except Data Source, General and Bars.
Data Source
| Setting | What it does |
|---|---|
| X-Axis | The column for the categories or dates along the axis. |
| Secondary X-Axis (Optional) | Splits each X-Axis value by a second column, such as orders by month and country. Each value of the second column gets its own bar or line. |
| Y-Axis | The number to plot. Click + Y-Axis to add more series, each with its own color swatch, and the trash icon to remove one. |
Customise a series
Click the sliders icon (Customise) next to a Y-Axis field:
| Setting | What it does |
|---|---|
| Graph Type | Bar Graph or Line Graph. Bar Line only. |
| Y-axis Position | Left or Right. Moving a series to the right adds a second axis with its own scale. On horizontal charts, this is X-axis Position, with Bottom or Top. |
| Tooltip Label | Renames the series in tooltips and trend line labels. |
| Tooltip | Turn off to leave the series out of the tooltip. |
| Legend | Turn off to leave the series out of the legend. Shown when the legend is on. |
| Value Labels | Shows this series' values on the chart. |
| Precision, Prefix / Postfix | Formats this series' values in value labels, tooltips and the summary section. They don't change the axis. Leave them empty to use Number formatting. |
| Line Style, Line Width, Show Points, Point Size | For line and area series. Override the chart's line style for this series. |
Labels
Lists the X-Axis values:
- Click a value to rename it. Renamed values are shown in bold, and hovering shows the original. Clear the text to restore it.
- Drag values to change their order, for 2 to 50 values without a Secondary X-Axis. Click Reset order to go back.
- When each bar can have its own color, the section is called Labels & Colors and has a swatch for each value.
Colors
When Individual Bar Color is on and bars are stacked, set a color for each segment of each bar. Click Reset colors to go back to the defaults.
General
Title, X-axis title, Y-axis title and Background Color. If some series are on the right axis, you can also set a Right Y-axis title.
Bars
For Bar and Bar Line charts:
| Setting | What it does |
|---|---|
| Bar width, Bar spacing | The width of the bars and the space between groups, from 0.1 to 1. Until you change them, Draxlr makes bars narrower when there are many labels. |
| Max bar thickness | The widest a bar can be, in pixels. |
| Corner radius | How rounded the bar ends are. |
| Round all corners | Rounds every corner instead of only the outer end. |
| Border width, Border color | An outline around each bar. |
| Individual Bar Color | Gives each bar its own color, set under Labels & Colors. |
| Barmode | With two or more series, or a Secondary X-Axis: Group puts bars side by side, and Stack stacks them. Stack (Comparison) appears with a Secondary X-Axis and one Y-Axis, and shows each value side by side in its own color. |
| Orientation | Vertical or Horizontal. Not available with a Secondary X-Axis. |
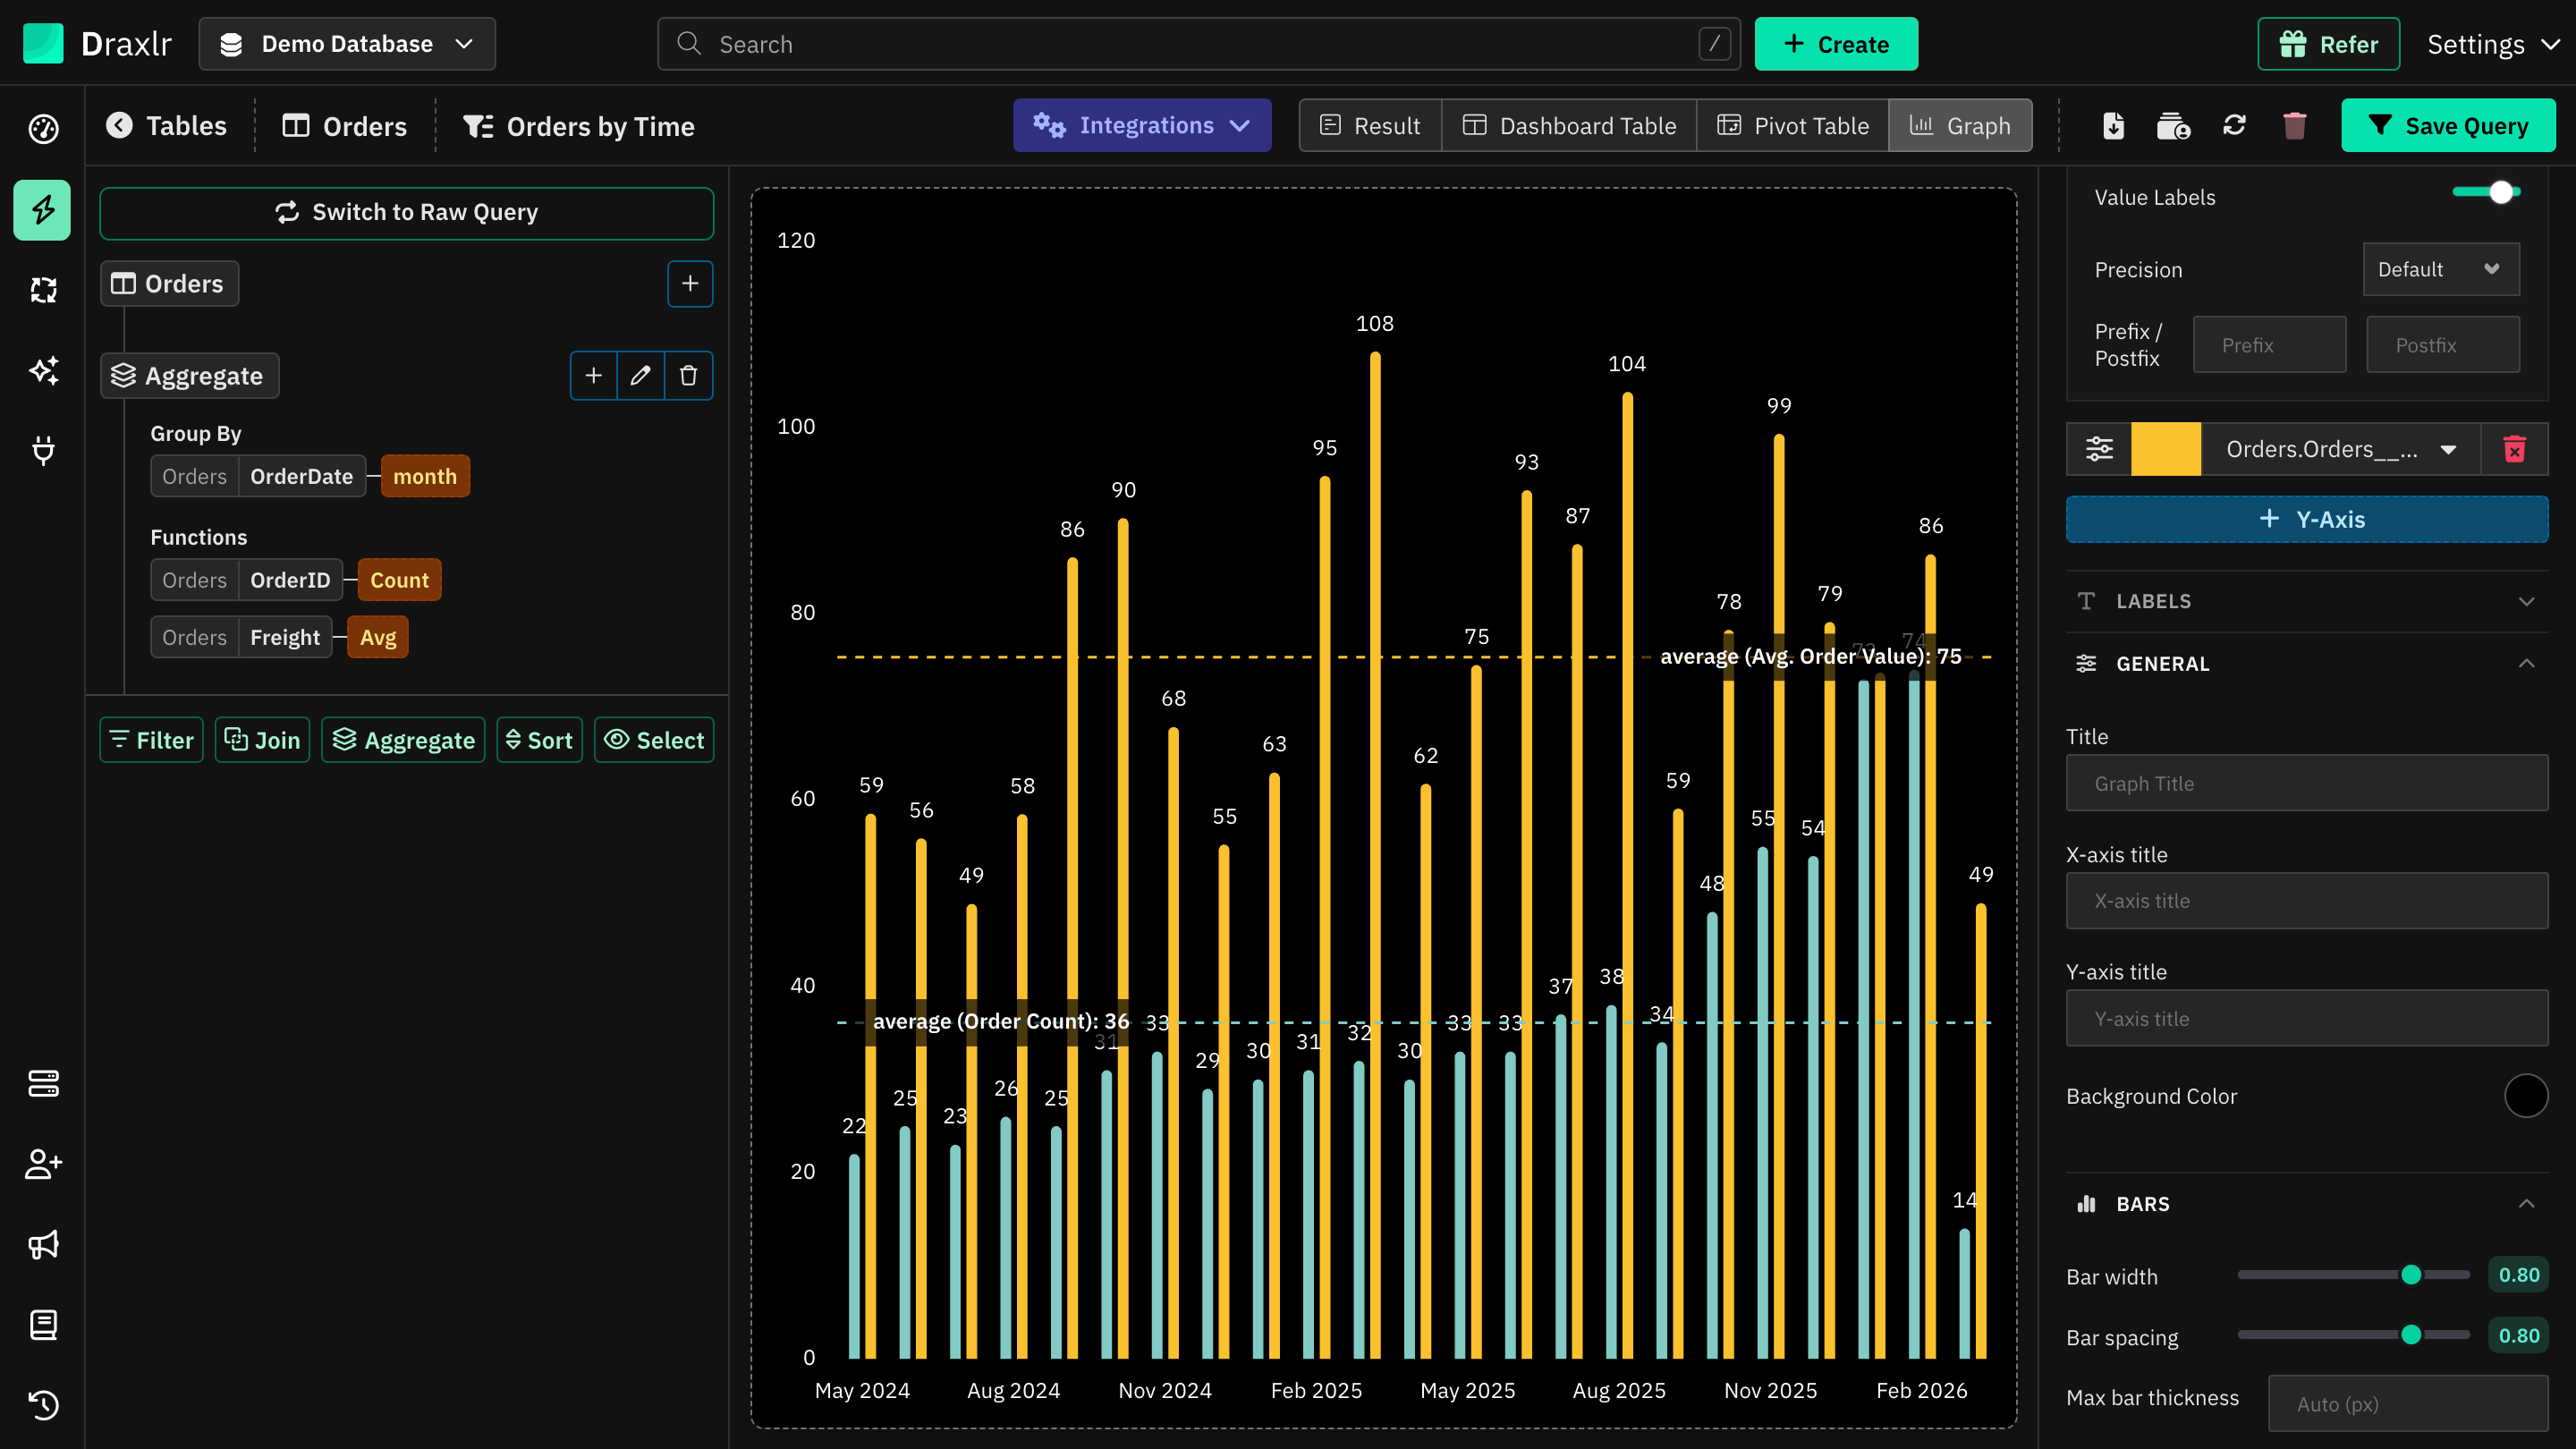
Line Style and Area Style
For Line, Area and the line series of Bar Line charts: Smoothing (how curved the line is), Line width, Line style (Solid, Dashed or Dotted), Stepped, Show points and Point size. Line and Area charts also have Barmode and Orientation here, to stack series or turn the chart sideways.
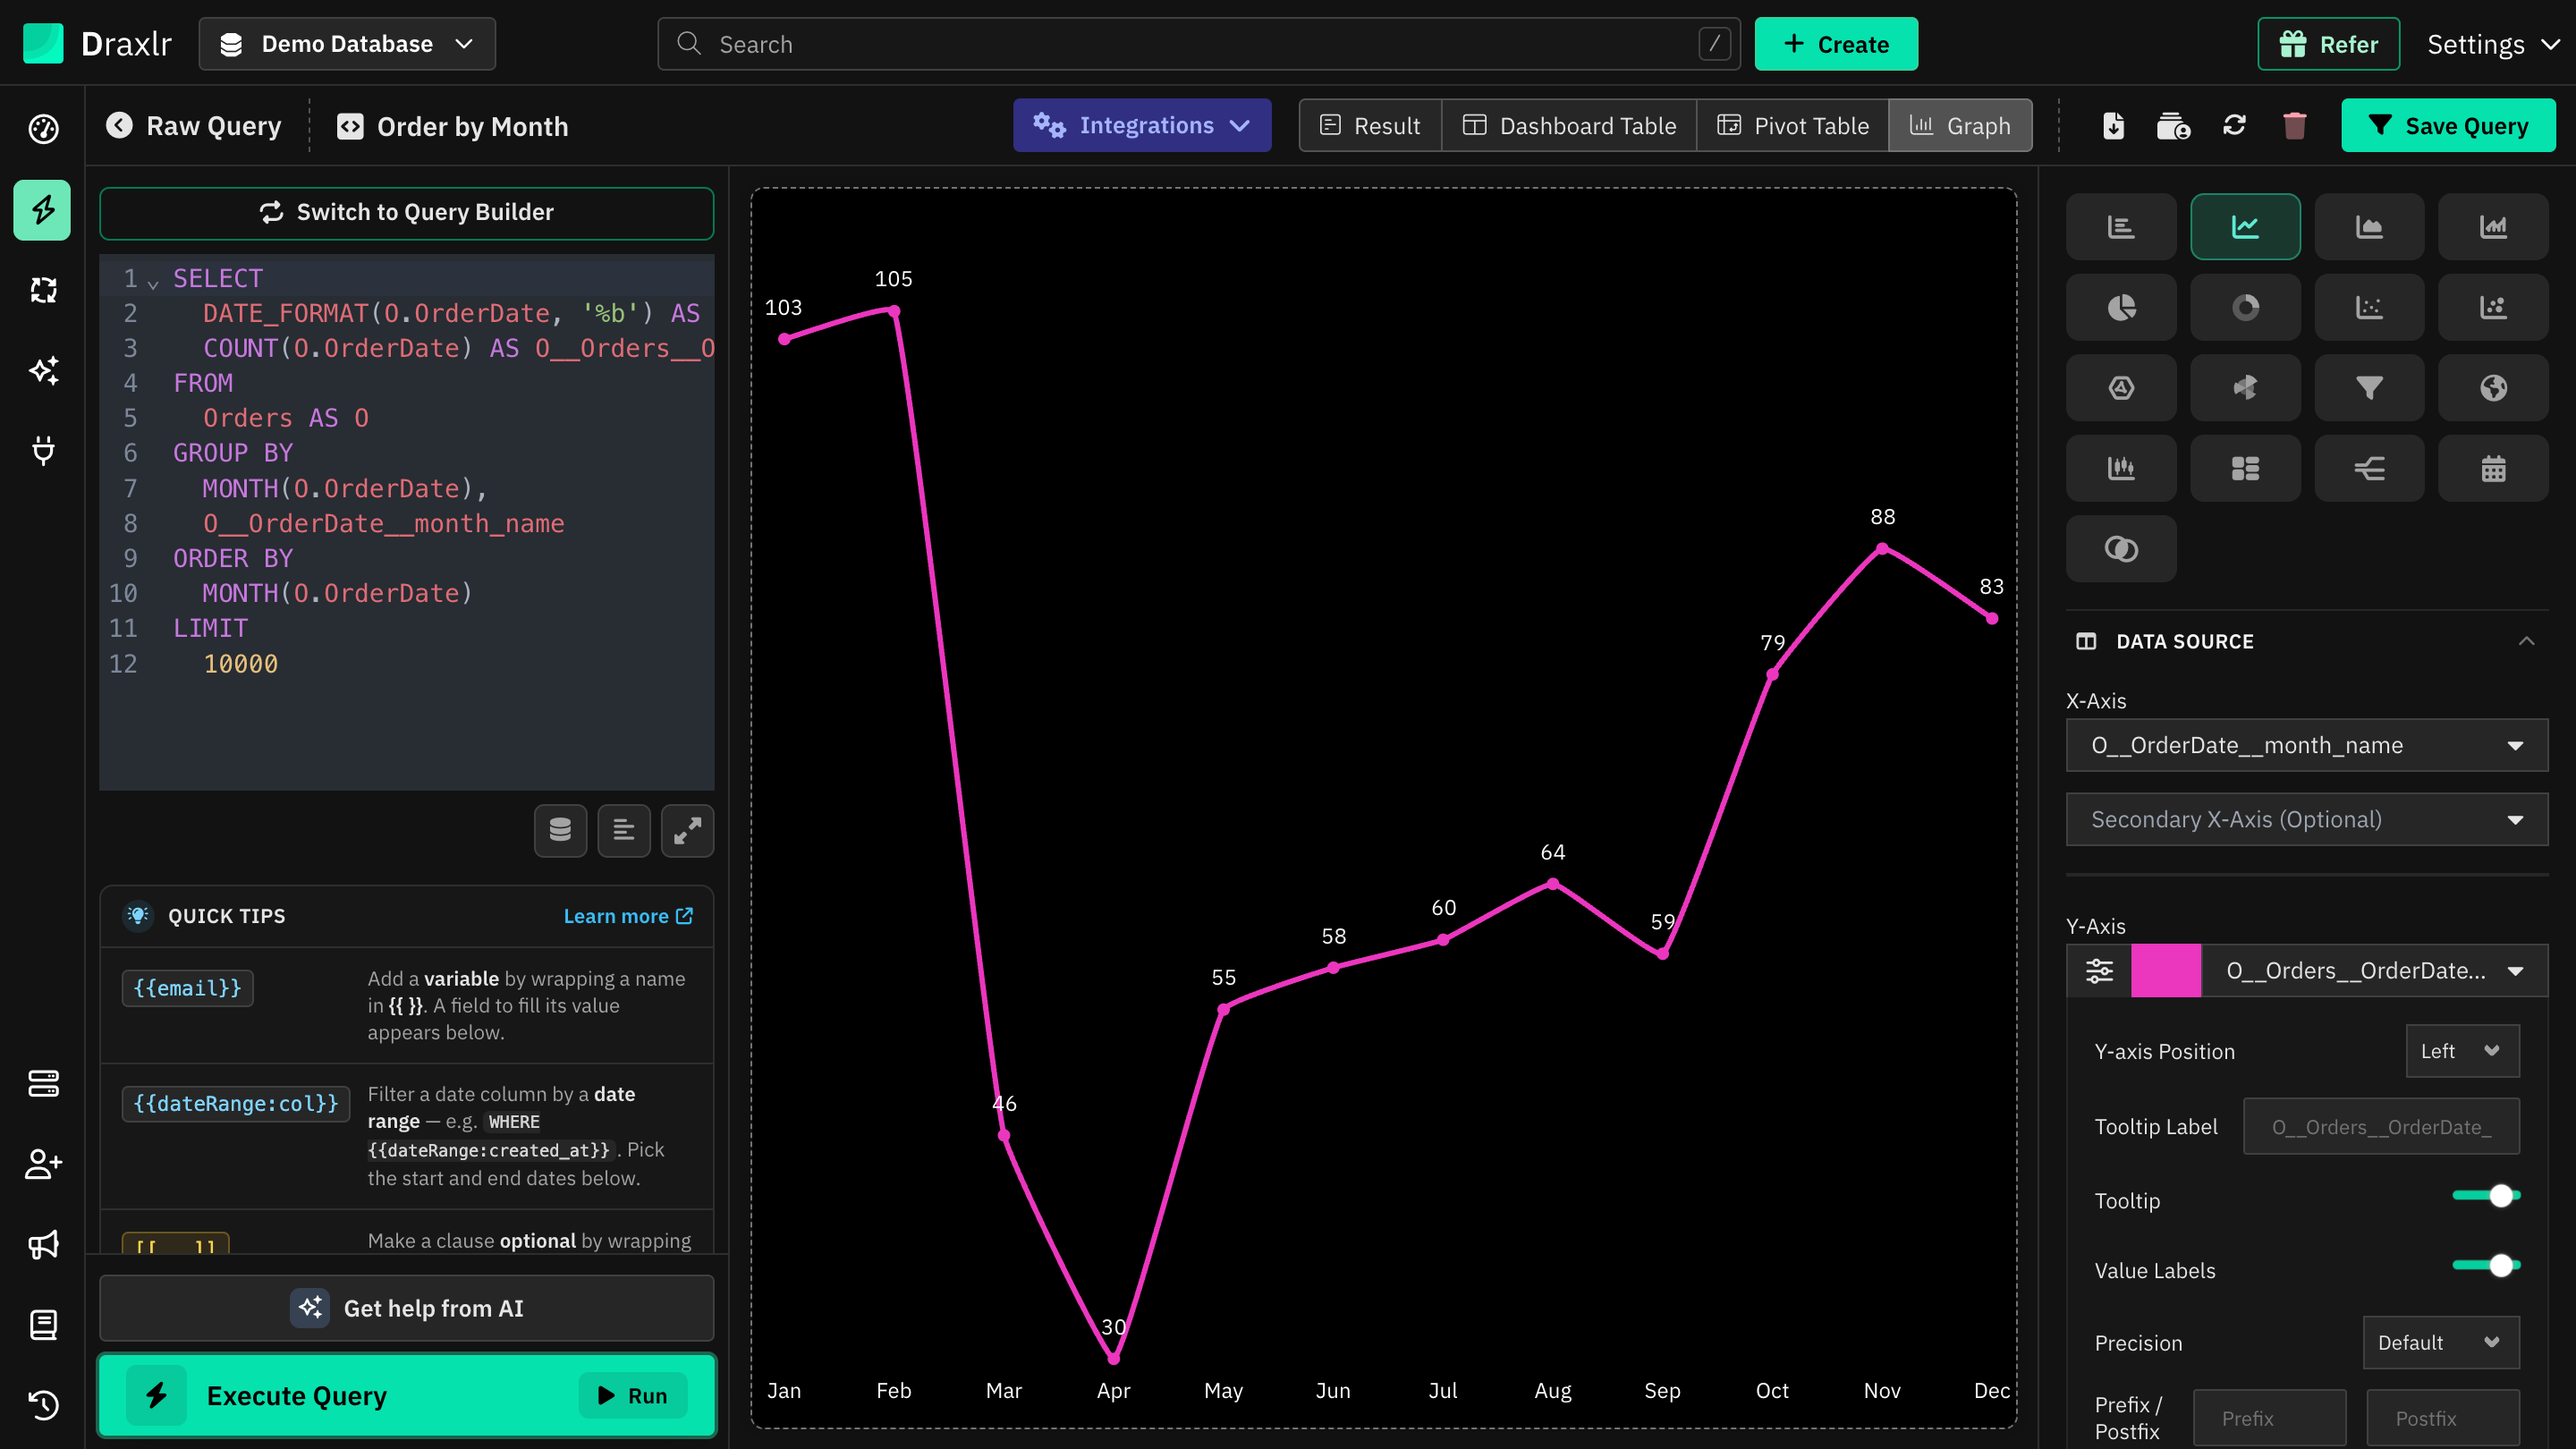
Legend
| Setting | What it does |
|---|---|
| Show Legend | Shows a legend of the series. Off by default. |
| Legend position | Top, Bottom, Left or Right. |
| Show Summary Section | Lists each X-Axis value with its values below the chart. |
Value Labels
Show values on Graph prints the values on the chart. Values of 0 and labels that would overlap are hidden.
Max Labels keeps the largest values and adds up the rest as Others. It's available for Bar and Bar Line charts with one Y-Axis, no Secondary X-Axis and no trend line.
Axes & Grid
| Setting | What it does |
|---|---|
| Start axis at zero | Starts the value axis at 0. |
| X-Axis Sort Order | Ascending or Descending sorts by the X-Axis values, such as names or dates, not by the numbers. A custom order from Labels takes priority; click Reset order first. |
| Logarithmic Graph | Uses a logarithmic value axis. |
| Left Y-axis | The axis Range (Min and Max), and the Prefix / Postfix and Precision of the axis labels. If some series are on the right, a Right Y-axis block appears too. |
| Show X-Axis Labels, Show Y-Axis Labels | Show or hide each axis's labels. |
| Show X-Axis Grid Lines, Show Y-Axis Grid Lines | Show or hide each axis's grid lines. |
| X-Axis Label Angle | Tilts the X-Axis labels: 0°, Auto, 30°, 45°, 60° or 90°. |
| Grid line style, Grid color | The style and color of the grid lines. |
The axis Prefix / Postfix and Precision format only the axis labels. To format the values shown on the chart and in tooltips, use Customise a series or Number formatting.
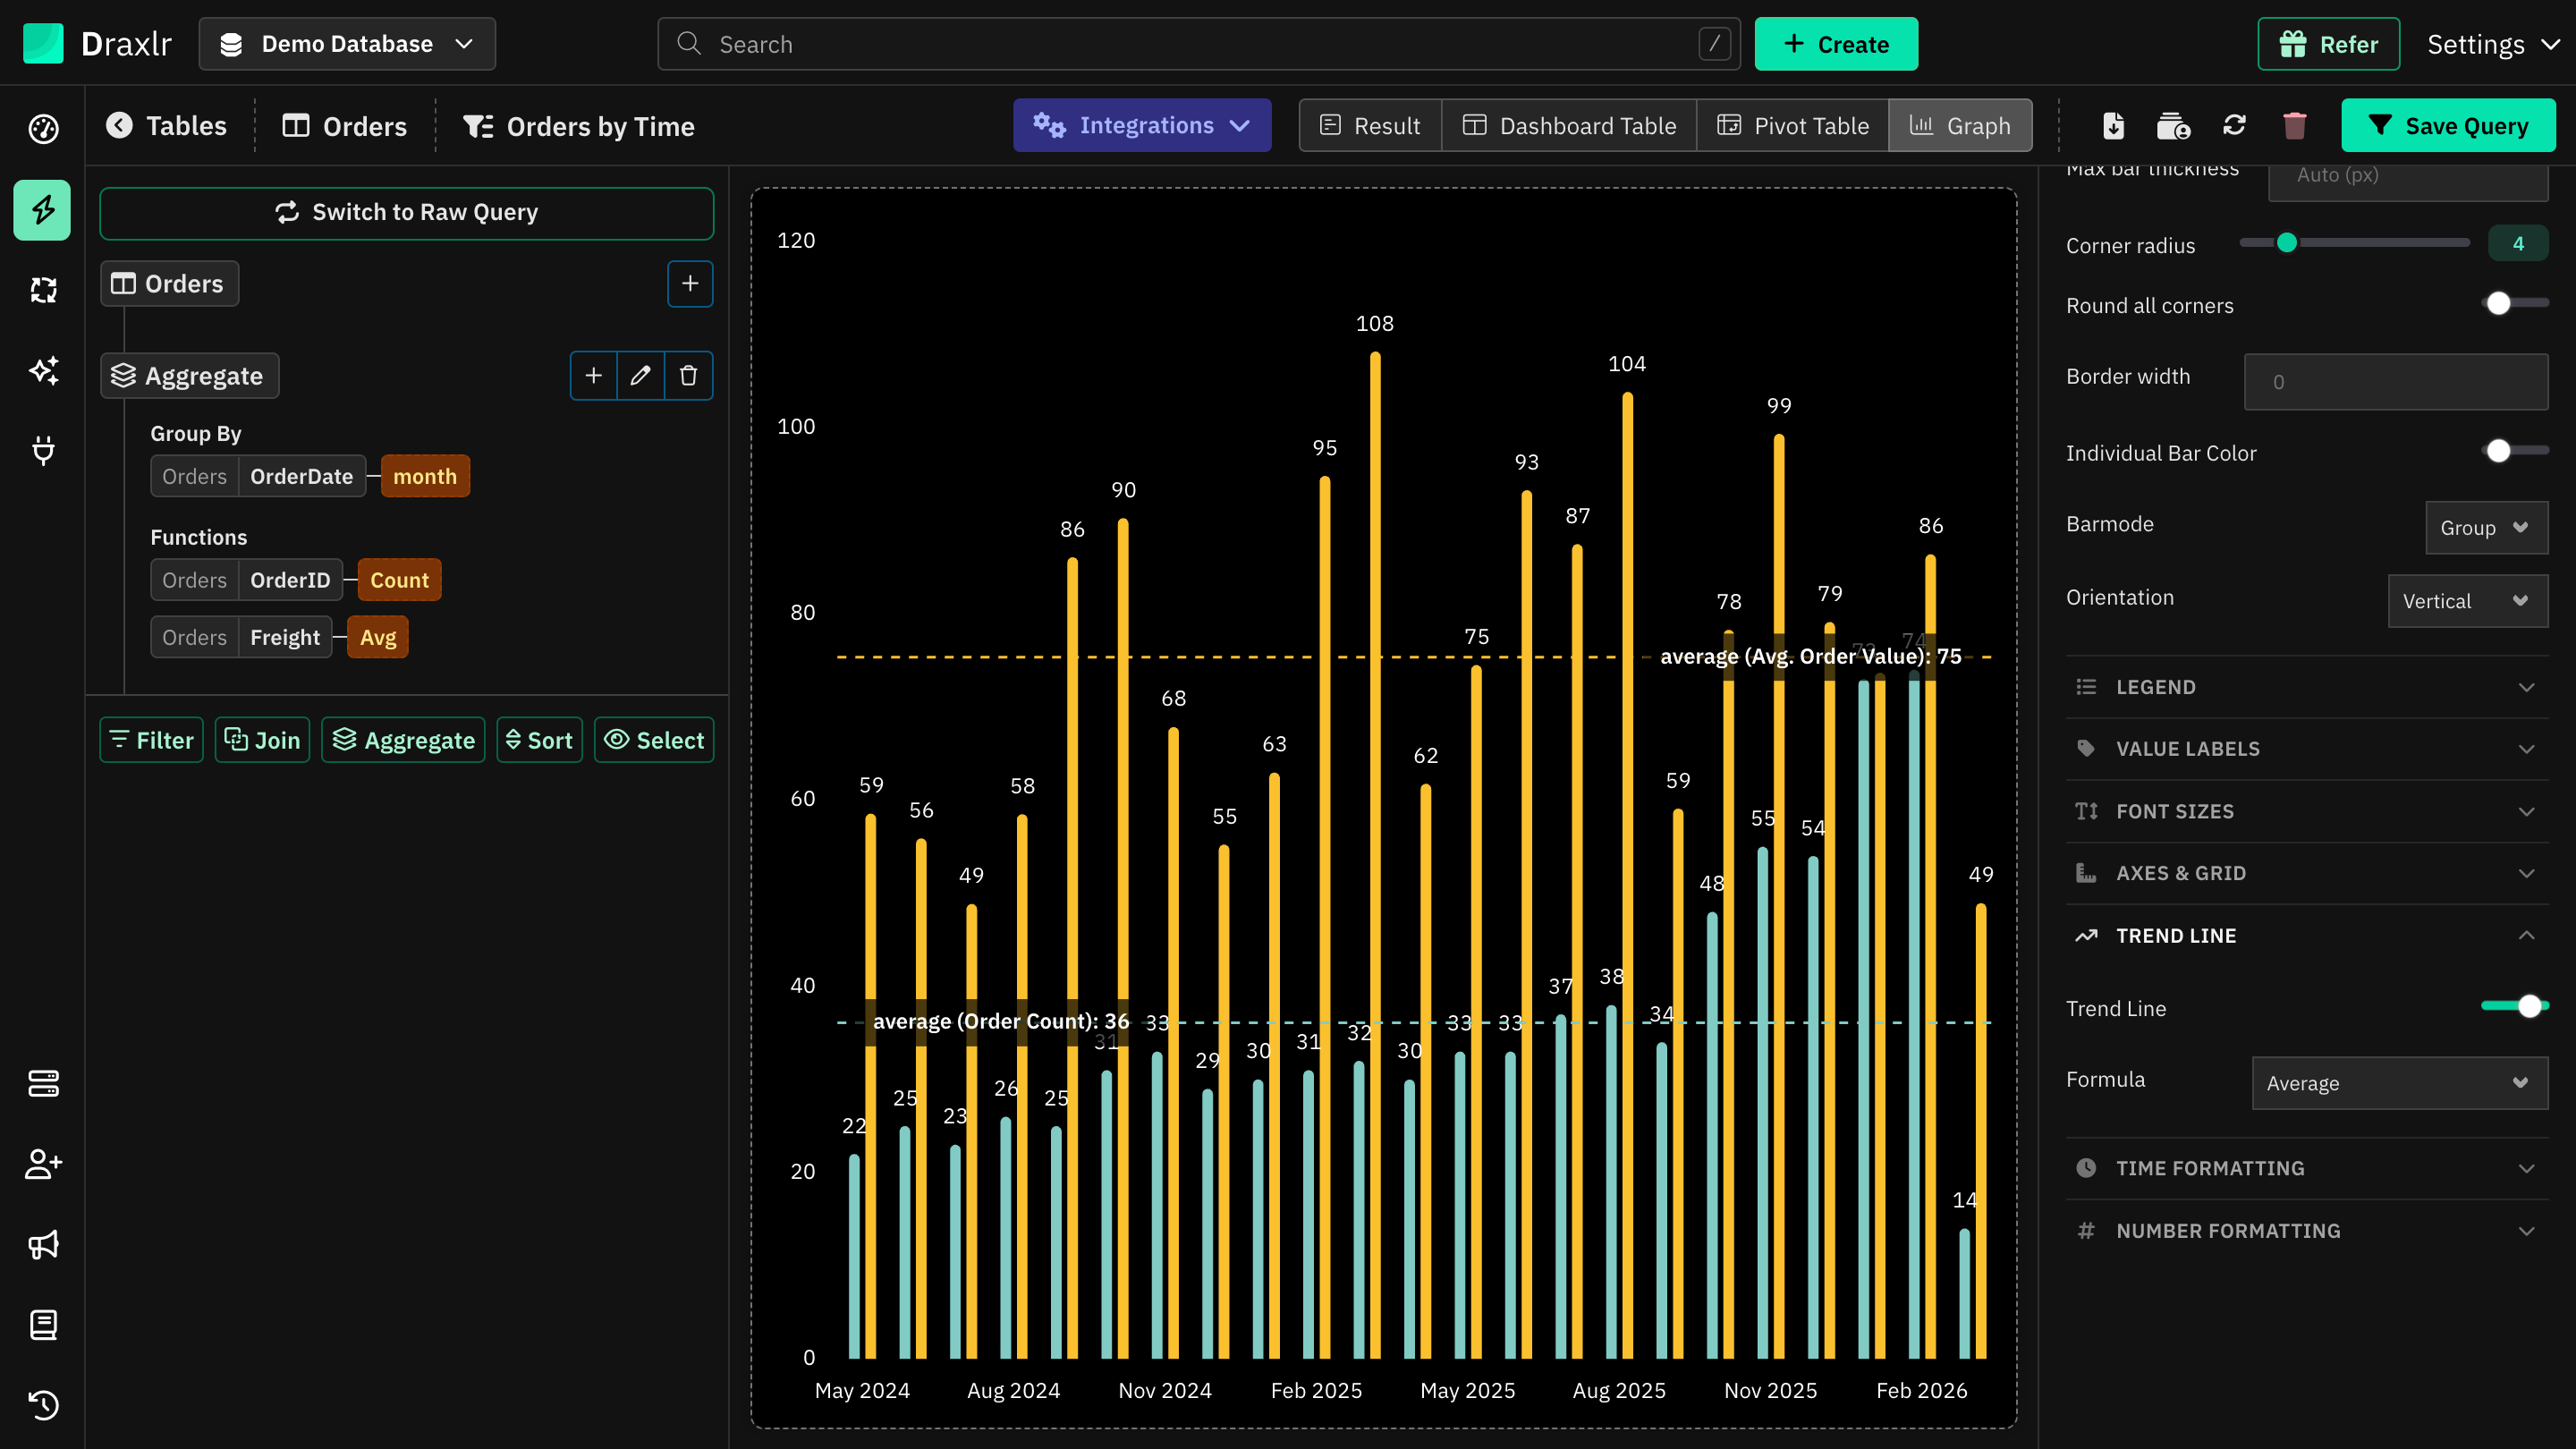
Trend Line
Turn on Trend Line and pick a Formula:
- Linear, Exponential, Logarithmic, Power or Polynomial draws a trend line for each series, named Trend of and the series' name.
- Average, Minimum or Maximum draws a dashed line across the chart, such as average (Order Count): 36.
- Custom Value draws a line at a Value you enter, with an optional Label.
Not available with a Secondary X-Axis.
Time Formatting
Turn on Time Formatting to change how dates are shown on the X-Axis, such as Feb 2026 (the default), 15/02/2026, Q1 2026 or Monday. It only changes the labels; the dates are grouped by your query.
Group Months by Year puts January to December on the axis, with one bar for each year. It's available for Bar charts with one Y-Axis, an X-Axis grouped by month and the Feb 2026 format.
Scatter, bubble, radar, funnel, box, tree map and sankey
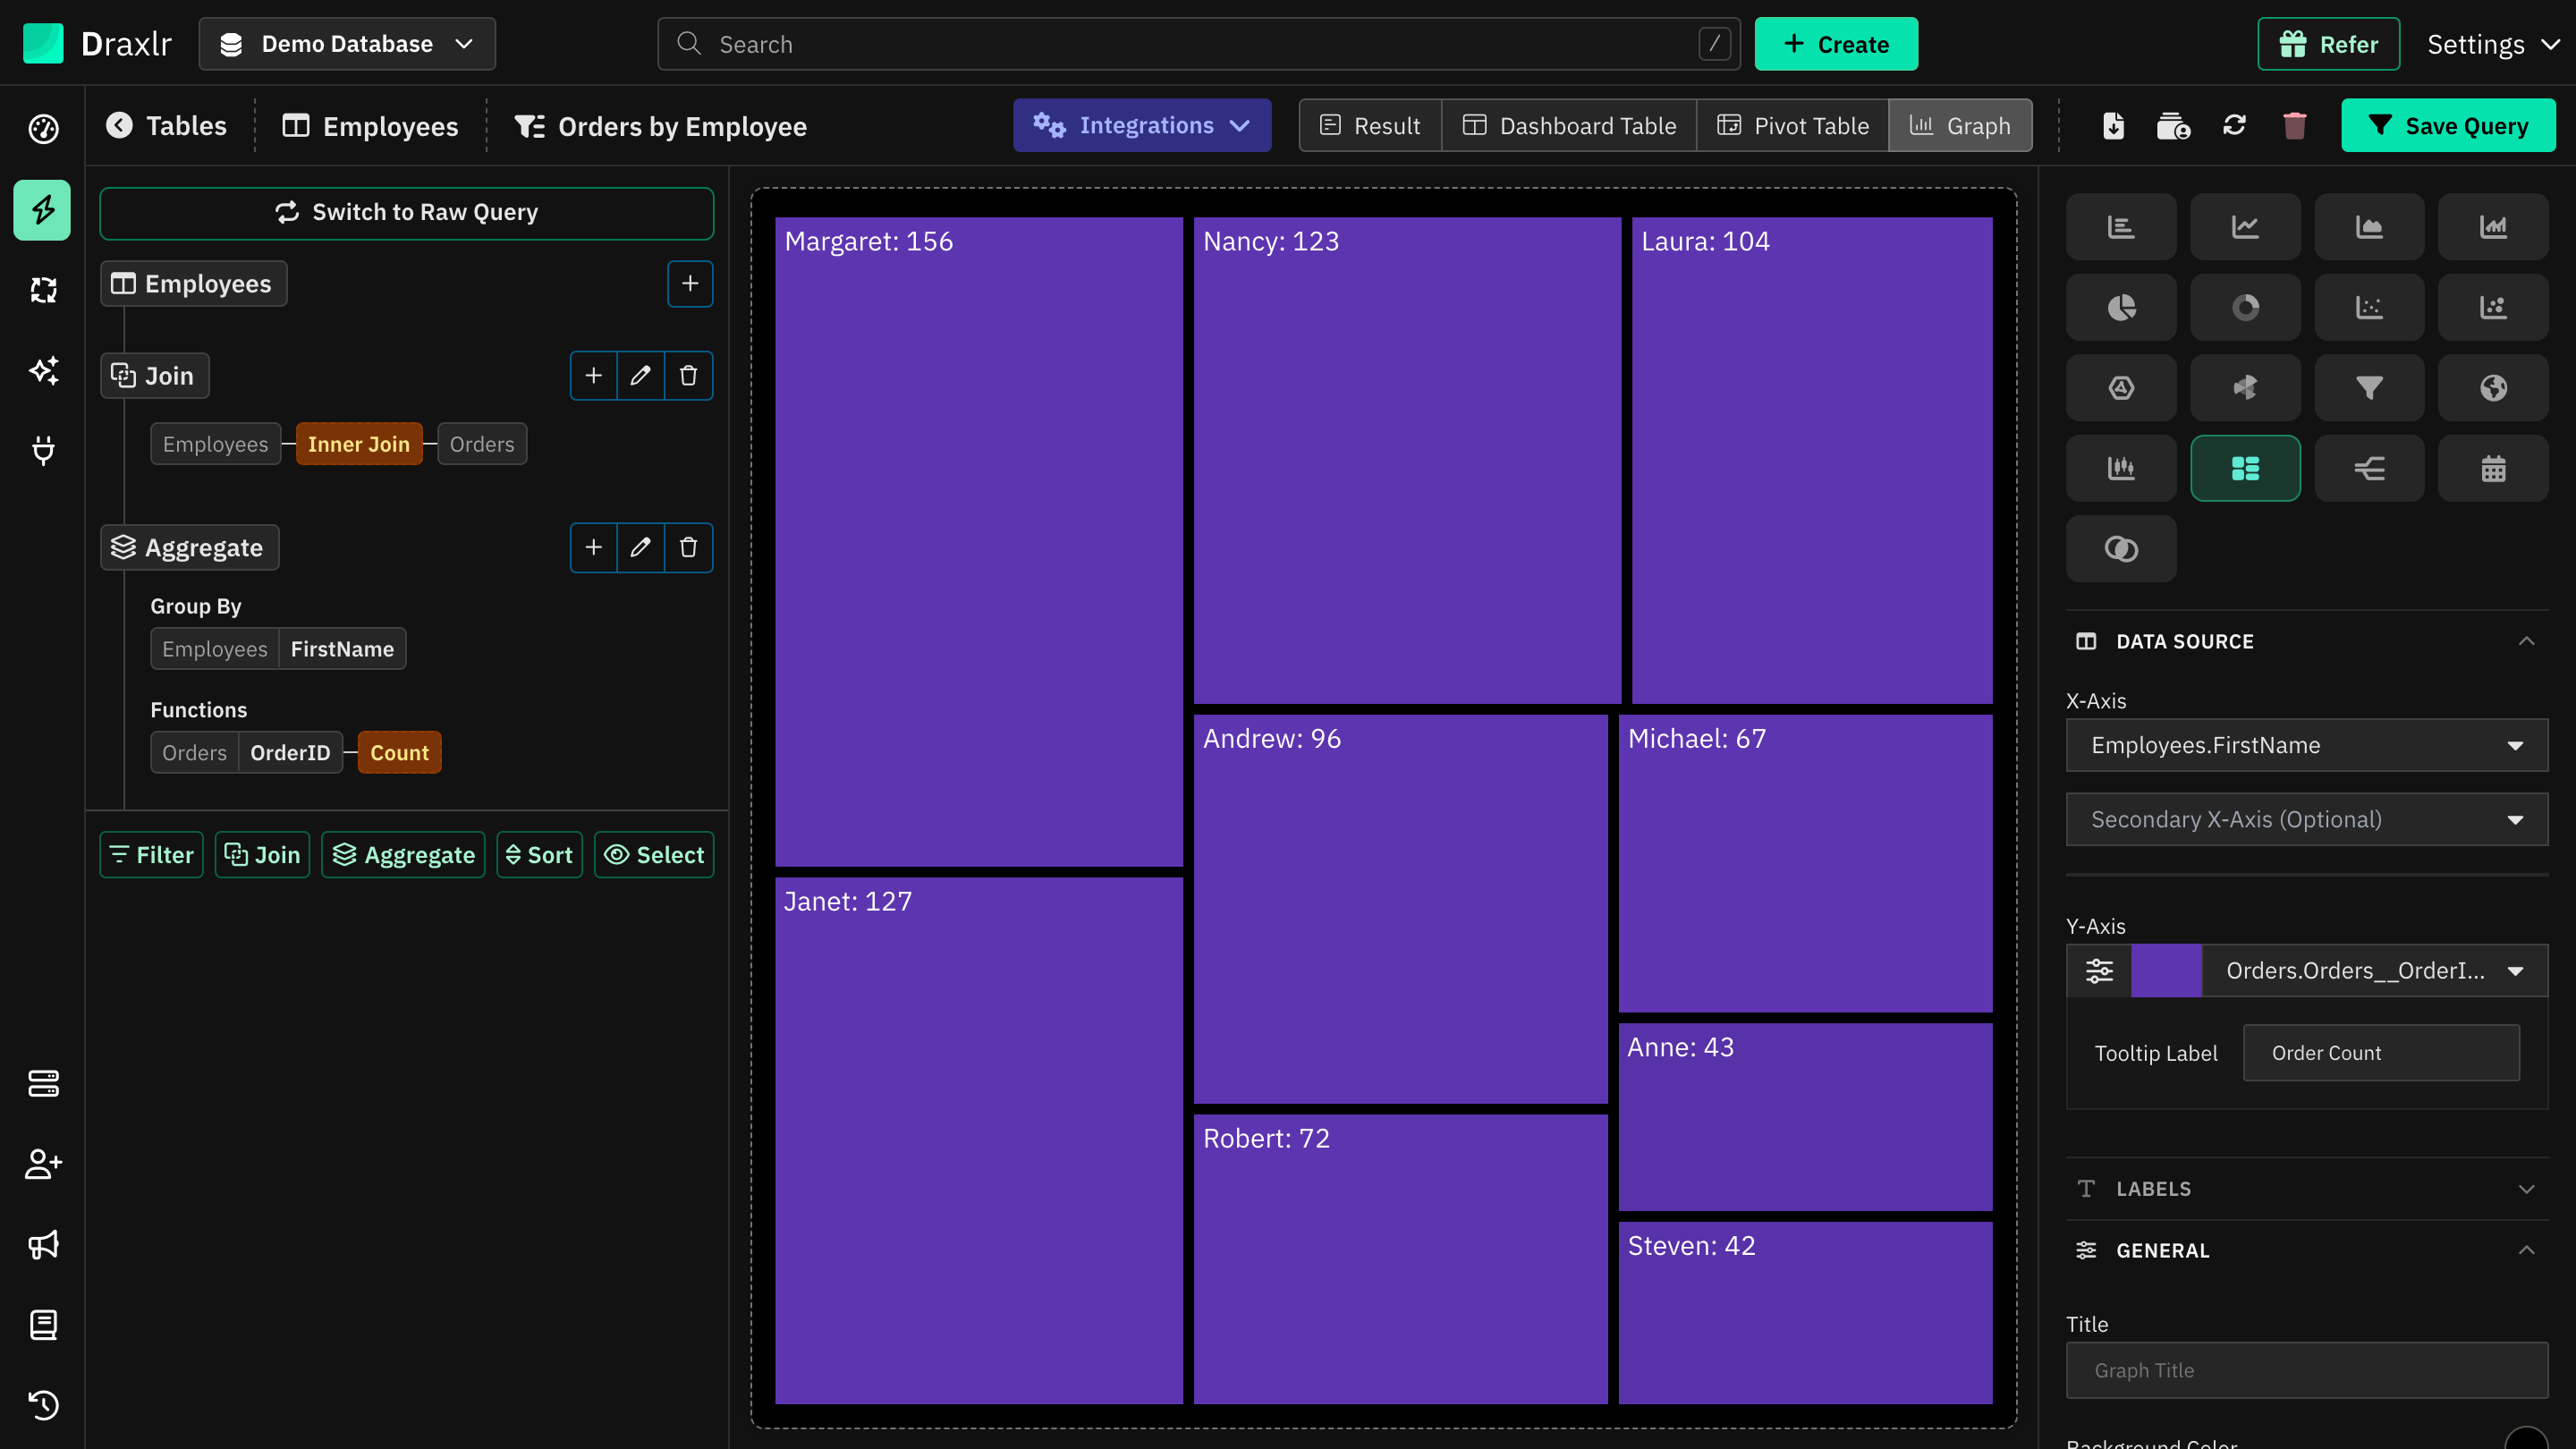
These charts use a shorter set of settings:
- Data Source: the fields listed in Chart types. Scatter, bubble and box charts need number columns. For a sankey, the target can't be the same column as the source or flow.
- Labels: rename values. Sankey, funnel and bubble charts also have a color for each value.
- General: Title, axis titles and Background Color. Funnel and box charts add Orientation, and box charts a Sort Order.
- Legend: as for bar charts. Not shown for box and tree map charts.
- Value Labels: for tree map, sankey, funnel and radar charts. Funnel charts add Label position, and radar charts Show as Percentage.
- Axes & Grid: a single axis Range, plus label and grid line settings.
- Trend Line: for scatter and box charts, with the Linear to Polynomial formulas.
Pie, doughnut and polar
Pick a Label column for the slices and one number Value. Click the sliders icon (Customise) next to the value to set its Tooltip Label.
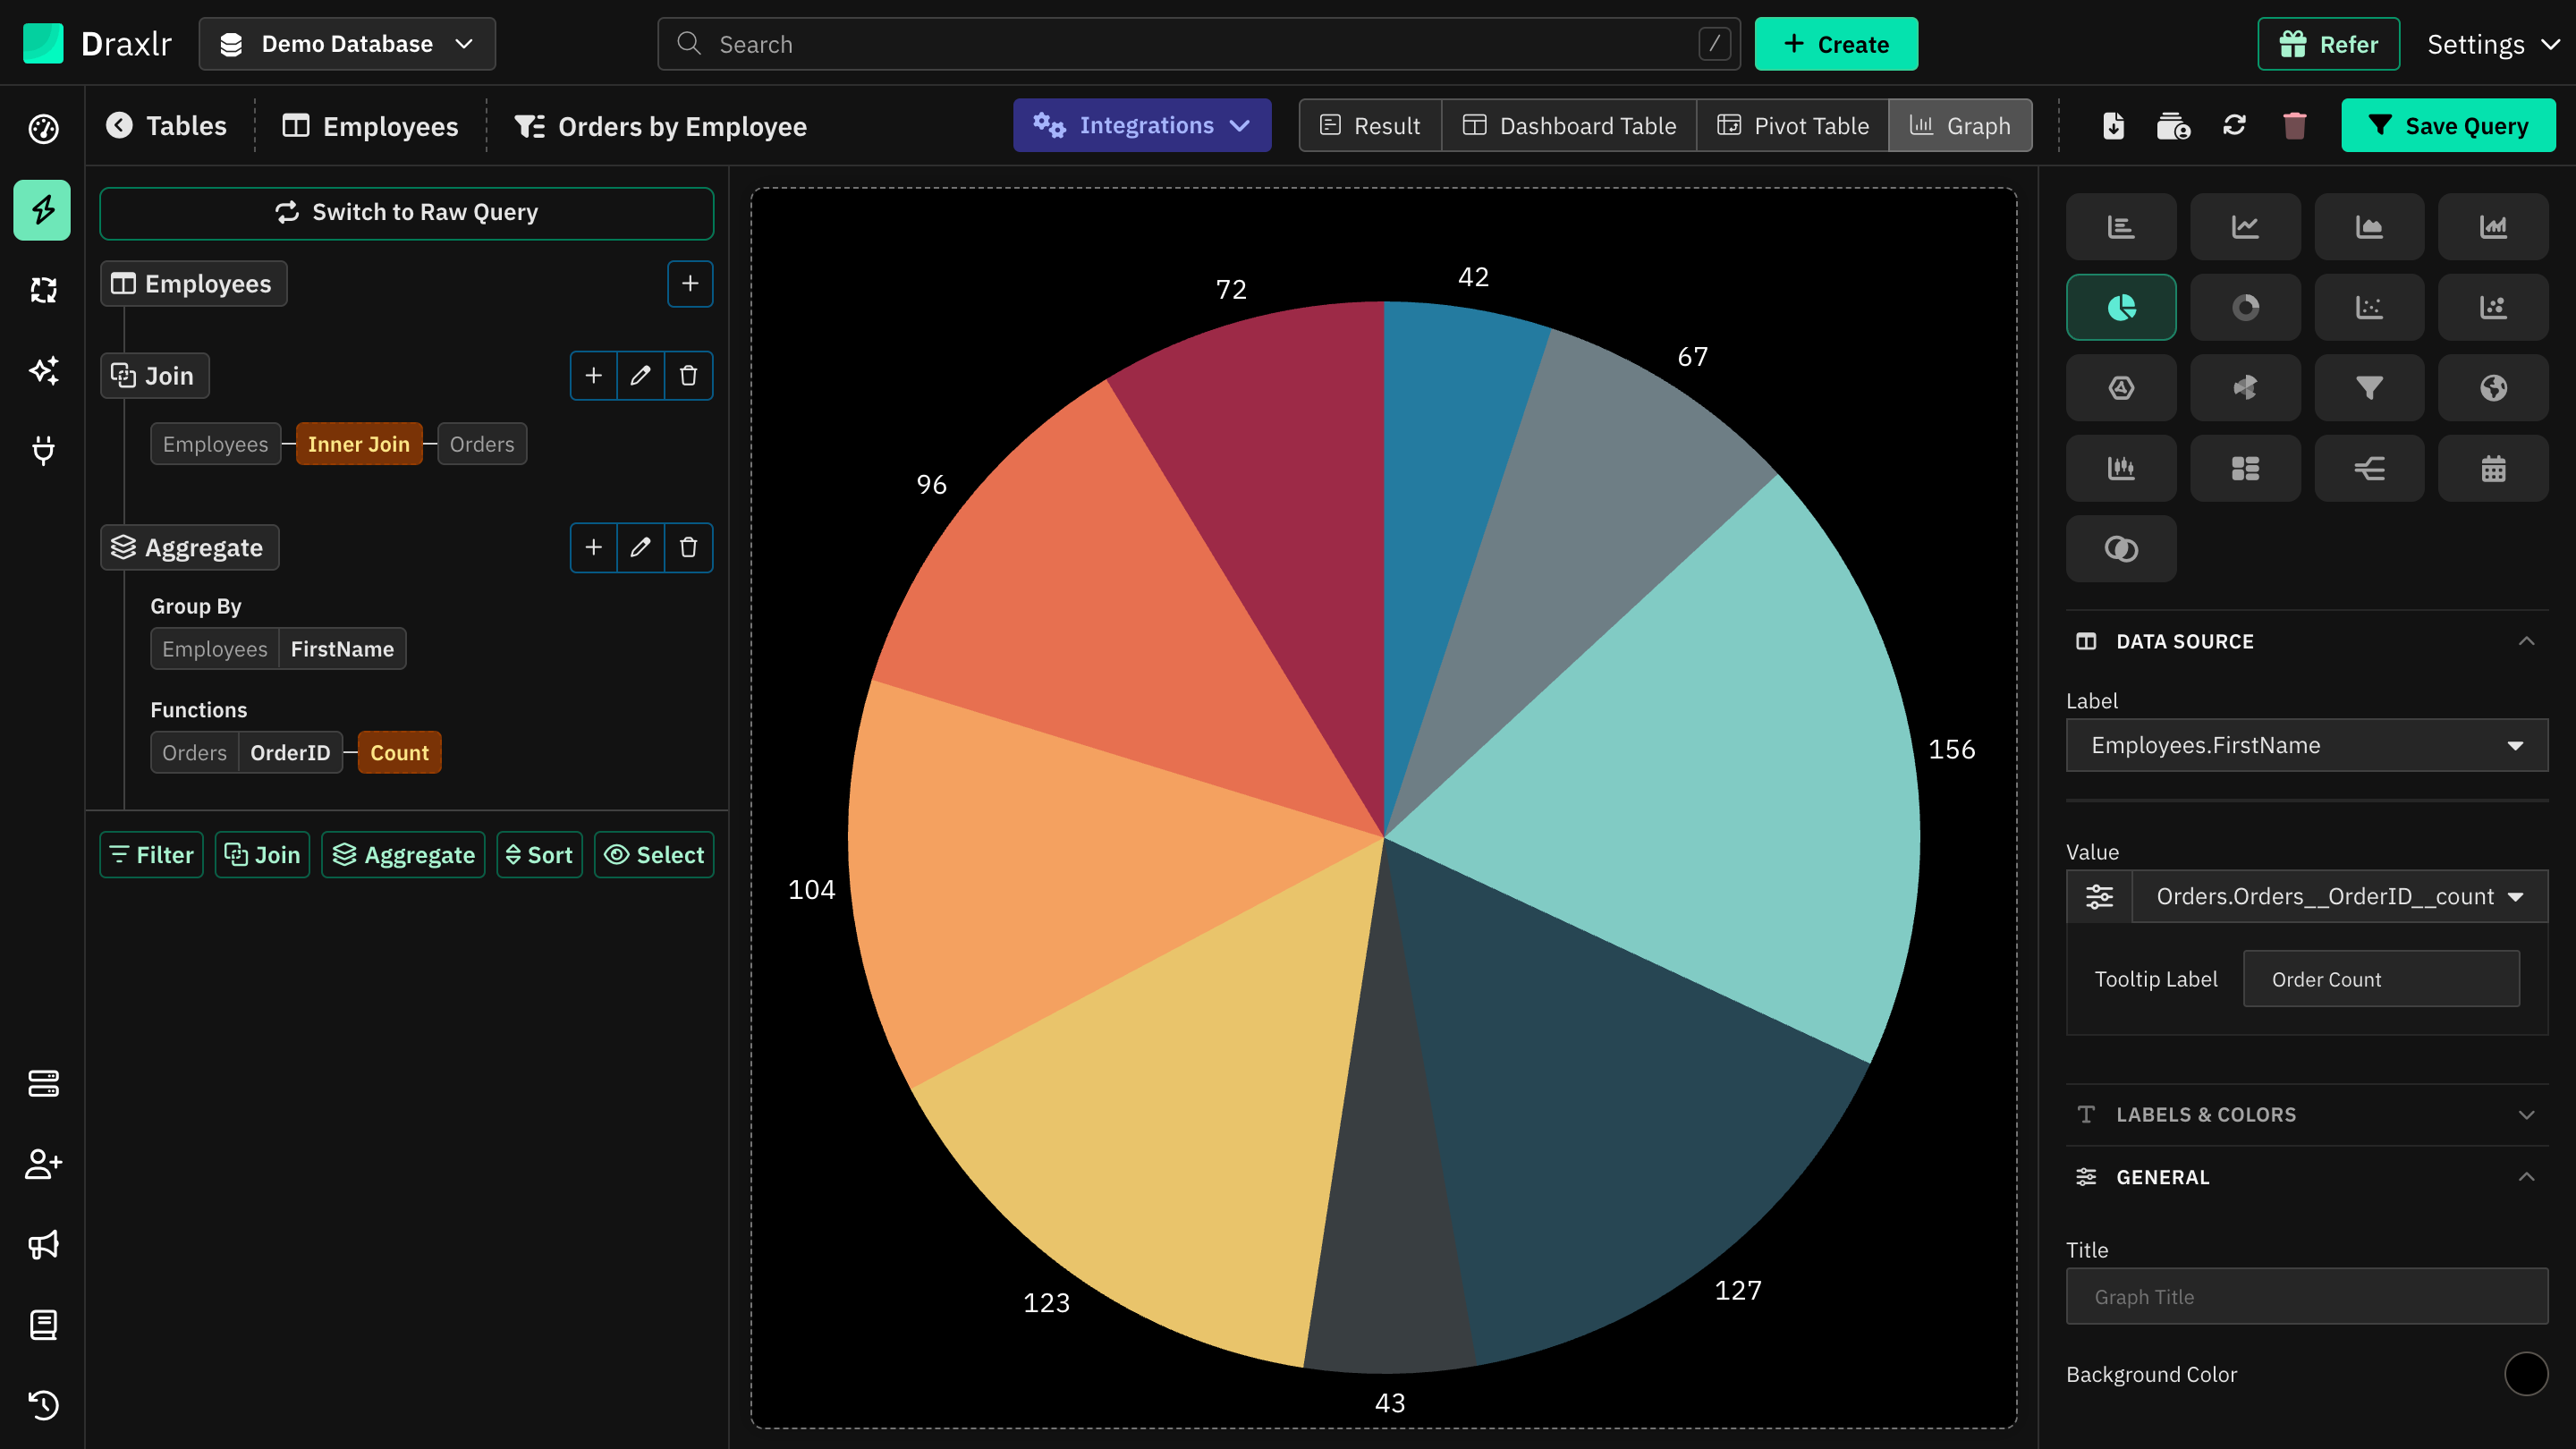
| Section | Settings |
|---|---|
| Labels & Colors | Every label is listed. Click a label to rename it, and click its swatch to change the slice's color. |
| General | Title, Background Color, and for doughnuts, Show Total to show the total in the middle. |
| Slices (pie and doughnut) | Inner radius (doughnut hole size), Start angle, Sweep (such as 180° for a half pie), Slice spacing, Explode slices, Corner radius, Hover pop, Border width and Border color. |
| Polar (polar only) | Start angle, Fill opacity, Border width, Border color, Grid color, and a Value Range with Min and Max. Values outside the range are left out. |
| Legend | Show Legend and its Legend position (Top, Bottom, Left or Right). Show Summary Section lists every label with its value next to the chart. |
| Value Labels | Show values on Graph prints each value by its slice. Show as Percentage shows each value as a share of the total. Max Labels keeps the largest slices and groups the rest as Others. |
| Font Sizes | See Font sizes. |
| Number Formatting | See Number formatting. |
Map
A map shades countries or regions by value, or places pins.
| Setting | What it does |
|---|---|
| Map Type | World, or Country for one country. |
| Country | The country to show, or United States & Canada. |
| Data Format | City / State, DMA (Designated Market Area) for the United States, or Latitude & Longitude. |
| Label | The column with the places. In Latitude & Longitude mode, pick a Latitude and a Longitude column, plus an optional Label. |
| Value | The number for each place. Its swatch is the color for the highest values. |
What the Label column can contain:
- World: country names or ISO codes, such as
France,FRorFRA. - Country, City / State: region names, codes such as
CAorUS-CA, city names, orCity, Stateto pick the right city. Postal codes also become pins. - DMA: DMA names, such as
Las Vegas, NV, or DMA codes.
| Section | Settings |
|---|---|
| General | Title and Background Color. |
| Map | Low value color, No-data color, Border color and Border width. Highlight highest value outlines the region with the highest value, in the Highlight color. Zoom controls and Heat legend are on by default. |
| Bubbles | Show bubbles draws a circle sized by value, with the value inside, in the Bubbles color. |
| Number Formatting | Formats tooltips, bubbles and the heat legend. See Number formatting. |
Calendar
A calendar shows a value on each day of a month or week.
| Setting | What it does |
|---|---|
| Date | A date or date-time column. If it has times, they're shown as time slots within each day. |
| Value | The number for each day. |
| Value Label | The name shown under each number and in the tooltip. |
| Color | The color used to shade the days. |
| Section | Settings |
|---|---|
| General | Title and Background Color. |
| Calendar | Default view (Month or Week), Week starts on (Sunday or Monday) and Hide weekends. Viewers can switch between month and week, and move between months. |
| Cells | Show value label, Shade cells by value, and for time slots, Time format (24-hour or 12-hour). |
| Font Sizes | Default size for the values. |
| Number Formatting | See Number formatting. |
If several rows have the same date and no time, only the first one is shown, so group your query by day.
Venn
A venn diagram shows how sets overlap, with circle sizes based on the values. Pick a Sets column and a Value column. Each row is a set, such as Email, or an overlap, named with &, such as Email & SMS.
| Section | Settings |
|---|---|
| Labels & Colors | Rename each set or overlap and pick its color. |
| General | Title and Background Color. |
| Venn | Fill opacity, Border width, Border color, Show set labels, Show values and Text color. |
| Font Sizes | See Font sizes. |
| Number Formatting | See Number formatting. |
Font sizes
Font Sizes sets a Default size for the chart's text, 12 by default. Below it, you can set sizes for the parts the chart shows, such as the title, axis labels, axis titles, value labels, legend, summary section and trend line label. Leave a size blank to use the default size, or click the reset icon next to it.
Number formatting
Number Formatting formats the chart's numbers, unless a series or axis sets its own:
| Setting | What it does |
|---|---|
| Abbreviate large numbers | Shows large numbers in short form, such as 1.2K or 3.4M. |
| Precision | The number of decimal places. Leave it empty to keep the value's own decimals. |
| Comma separator | Adds thousands separators. On by default. |
| Decimal separator | . (decimal point) or , (comma). Shown when Comma separator is on. |
| Prefix, Postfix | Text added before or after every number, such as $. |
| Pre-Formatting | Uses the formatting already in your query result, and turns off Precision, Prefix and Postfix. |
Use the chart
- Tooltips: hover over the chart to see the values.
- Zoom: on bar, line, area, bar line, scatter, bubble and box charts, drag across the chart to zoom in. Click Reset Zoom to zoom out.
- Drill down: on most charts, click a bar, point or slice to drill down, such as to see the rows behind it. Click Back to previous Query to return.
Things to know
- Missing fields: until the required fields are picked, the chart shows Please select all the Dimensions. Other messages explain fields that don't fit the chart, such as All the Axes of Scatter graph must be numeric.
- One value per chart: charts that take one value, such as pie or funnel, save only the first Y-Axis field.
- Long labels: axis labels longer than 25 characters are shortened with ….
- Saving: on a saved query, click Save Query to keep your changes. You can't save while the chart shows an error. See How settings are saved.
- On dashboards: the element shows the chart with these settings. To embed a single chart, see Embed Dashboard Element.