Visualization > Dashboard Table
Format a Draxlr query result as a Dashboard Table, with renamed, reordered and hidden columns, number and date formatting, color scales, badges, progress bars, links and row highlights.
A Dashboard Table shows your query result as a formatted table. Unlike Result, which shows raw values, you can rename, reorder and hide columns, format numbers and dates, and add colors, badges, progress bars, links and images.
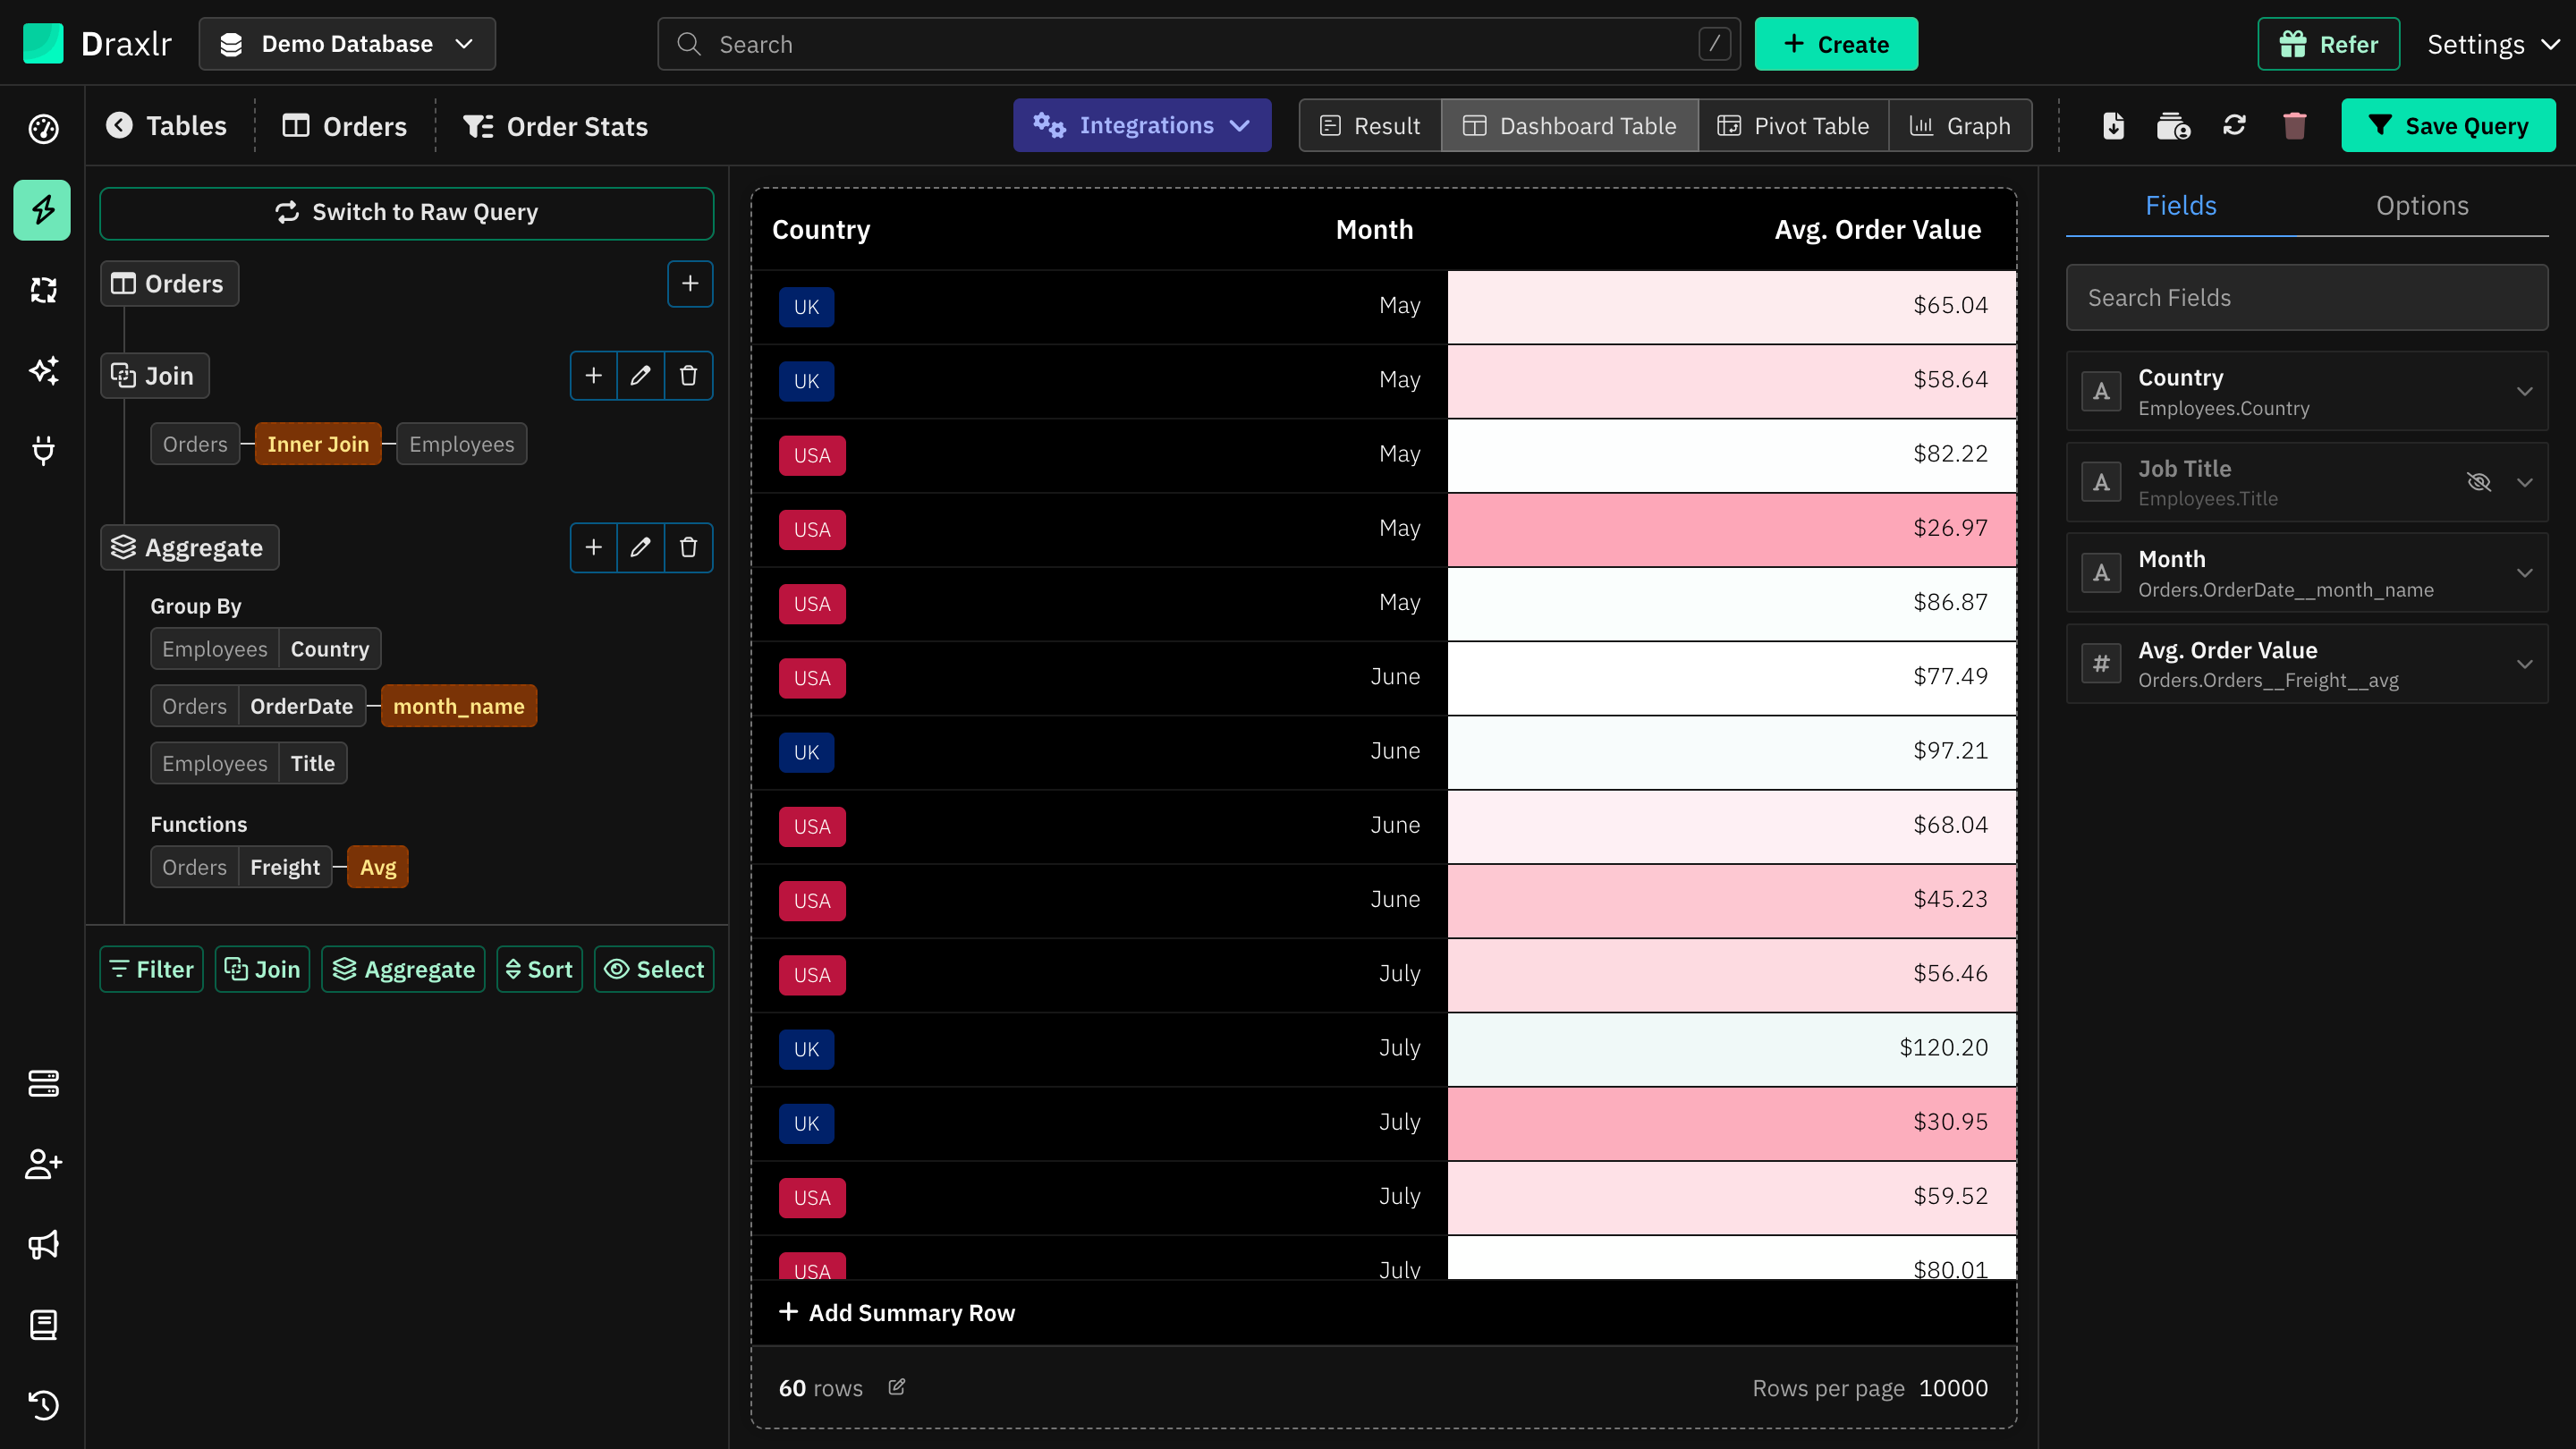
To use it, run a query in Browse Data and click Dashboard Table at the top. The settings panel opens on the right with two tabs, Fields and Options.
Fields
The Fields tab lists the table's columns:
- Search Fields finds a column by its name or label.
- Drag a column by its icon to reorder the table.
- Click the eye icon to hide or show a column.
- Click a column to open its settings. One column's settings are open at a time.
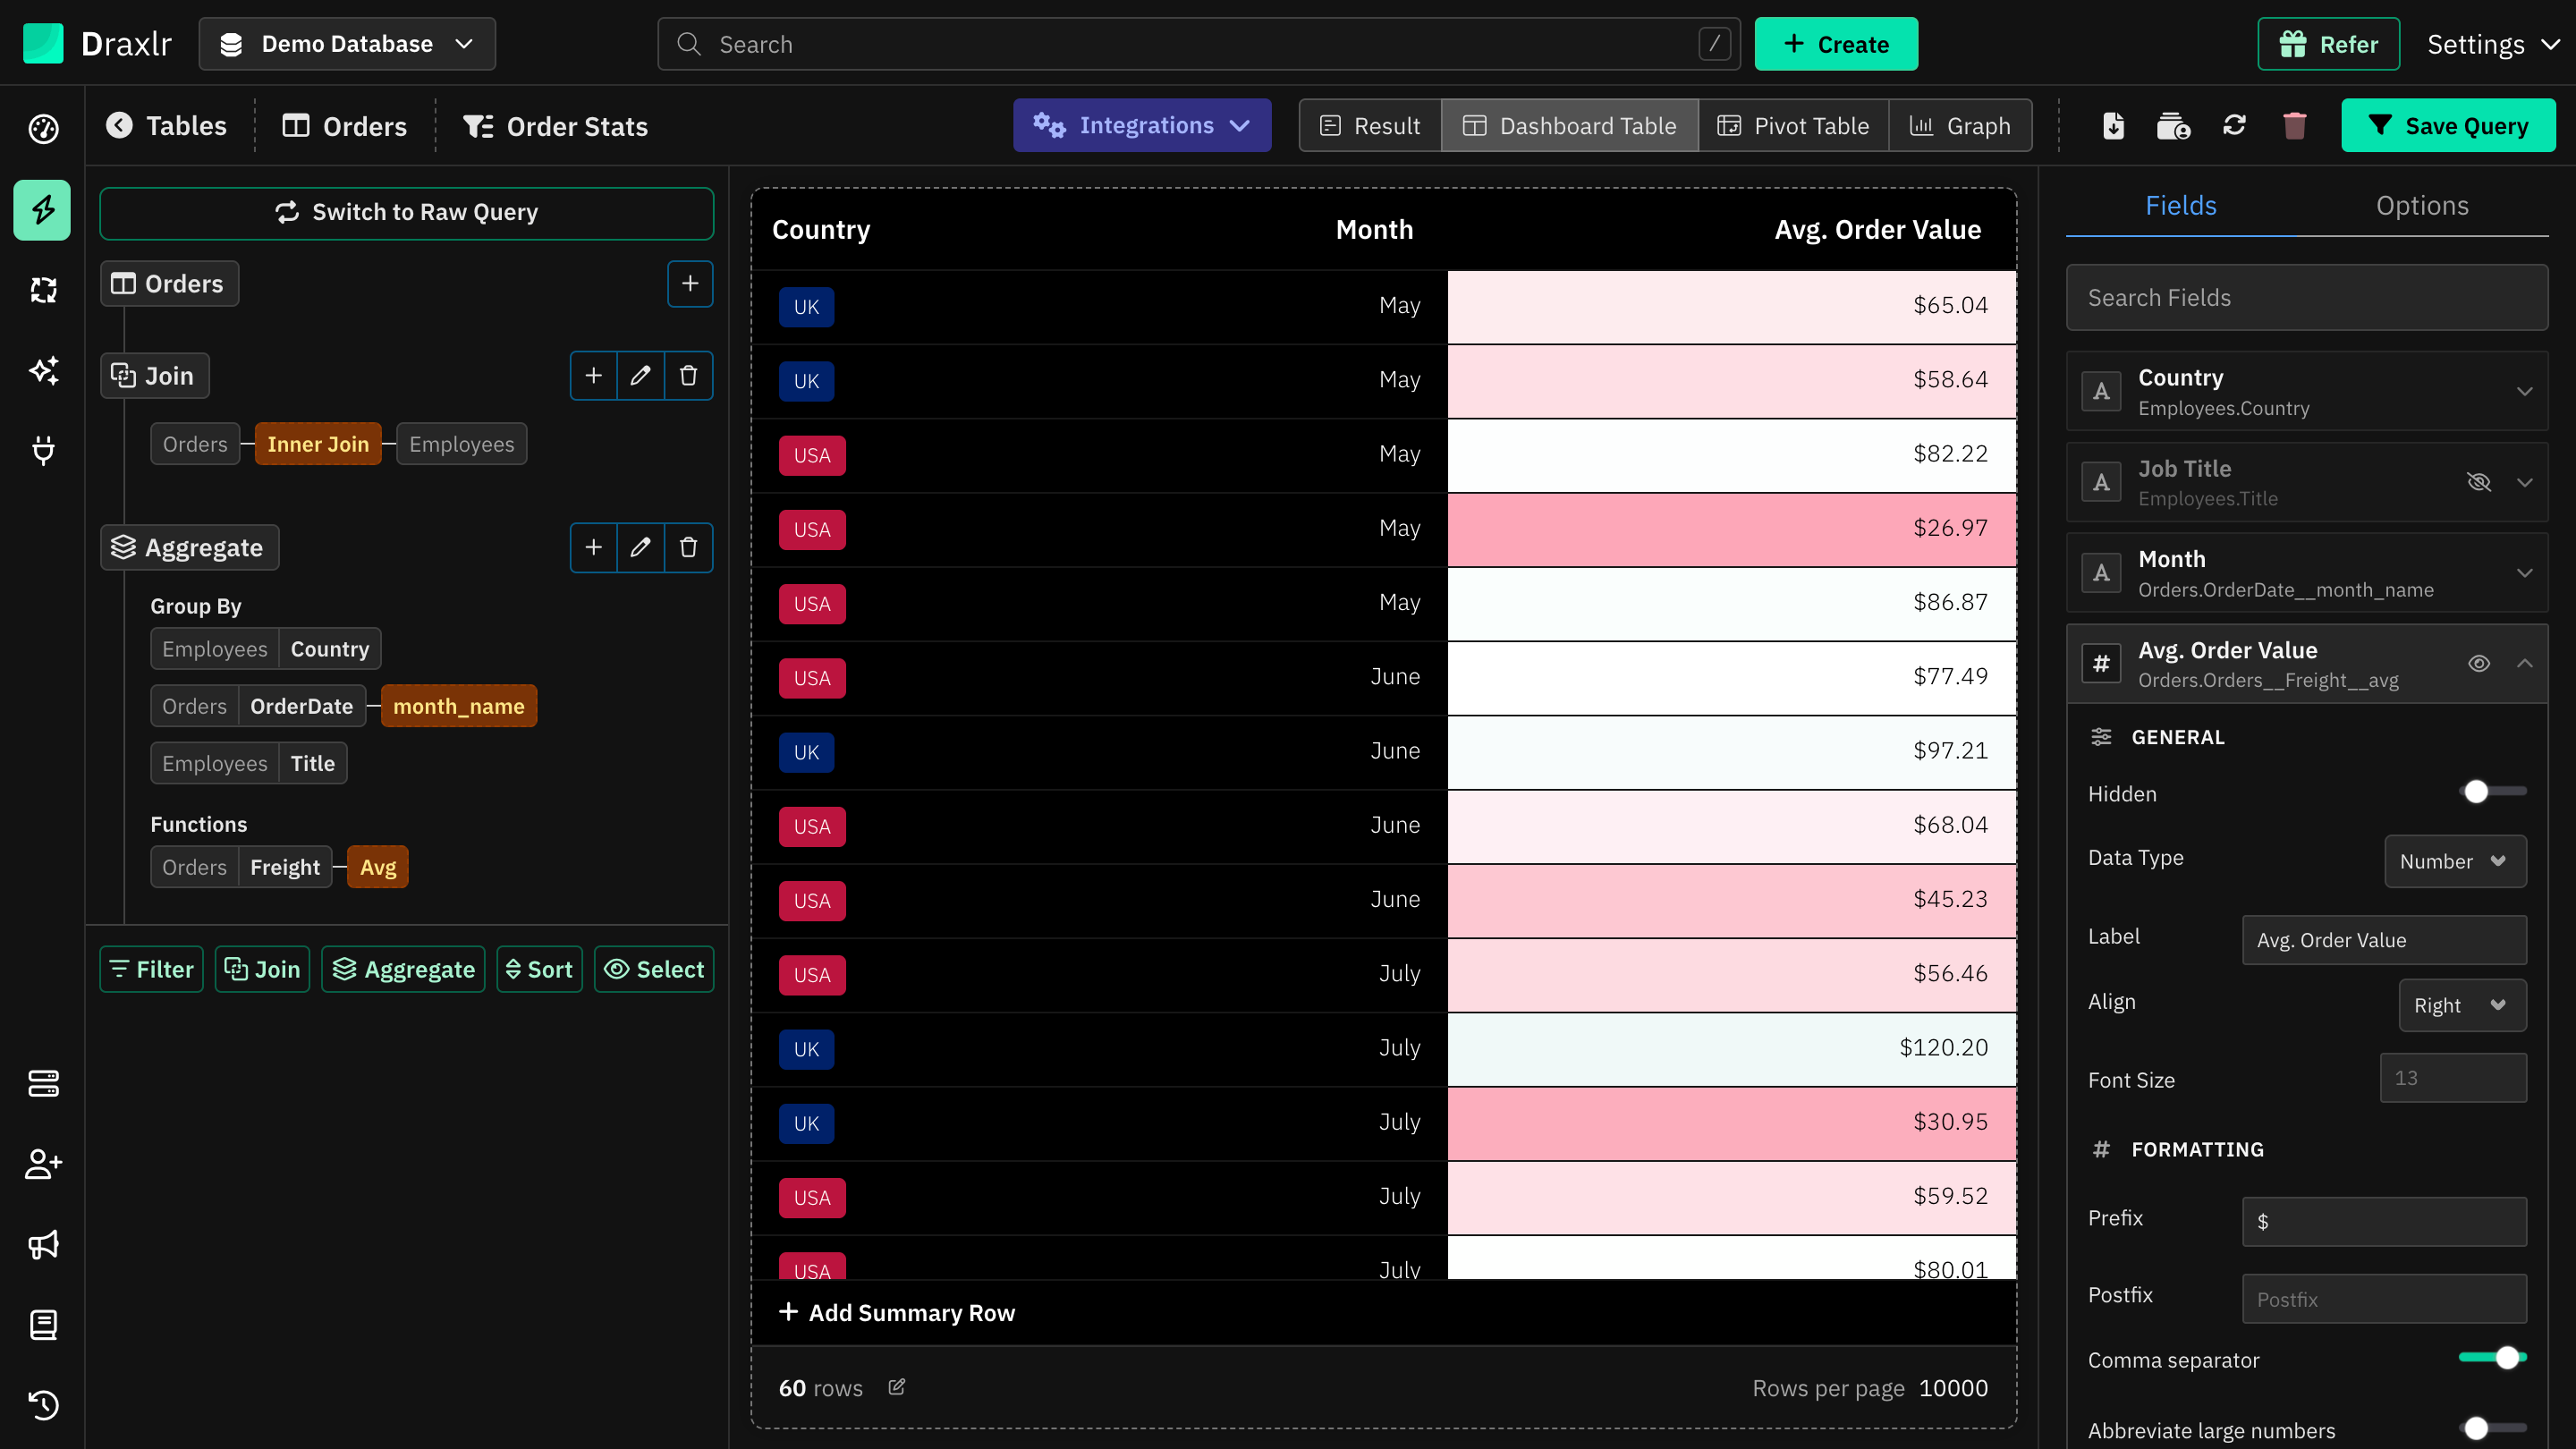
General
| Setting | What it does |
|---|---|
| Hidden | Hides the column. |
| Data Type | Text, Number, Boolean or Date. Draxlr detects it from the data, and it decides which options are shown below. |
| Label | Renames the column's header. |
| Align | Left, Center or Right, for the header and cells. |
| Font Size | Font size for this column's cells. |
Formatting
| Setting | Data type | What it does |
|---|---|---|
| Prefix, Postfix | All | Text added before or after each value, such as $ or kg. |
| Comma separator | Number | Adds thousands separators. On by default. |
| Abbreviate large numbers | Number | Shows large numbers in short form, such as 1.2K or 3M. |
| Precision | Number | The number of decimal places, from 1 (no decimals) to 0.000001. Leave it empty to keep the value's own decimals. |
| Decimal separator | Number | . (decimal point) or , (comma). Shown when Comma separator is on. With a comma, numbers look like 1.234,56. |
| Formula | Number | Changes each value with a formula. Use X for the cell's value, such as (X + 2) * 3 or X / 1000. |
| Date Format | Date | How dates are shown, such as 15 Feb, 2026, 15/02/2026, Q1 2026, Feb 2026 or Monday. Default shows the value as it is. |
Display
| Setting | Data type | What it does |
|---|---|---|
| Category Badge | Text, Number, Boolean | Shows each value as a colored tag. Click (Customize) to pick a color for each value, for up to 1,000 values. |
| Show as Progress Bar | Number | Draws a bar for each value. Set Progress Bar Target to Maximum or Sum of the column, or Manual with a Manual Value, and pick a Color. |
| Color Formatting | Number | Colors each cell's background by its value. See Color formatting. |
| Show as Link | Text | Shows the value as a link that opens in a new tab. Email addresses open your mail app, and https:// is added when missing. |
| Show as Image | Text | Shows an image from the URL in the cell. Click it to see it larger. |
| Show as Icon | Boolean | Shows a check or a cross instead of true or false. |
Some display options can't be combined. Turning on Category Badge turns off links, images, progress bars, icons and color formatting. Show as Progress Bar and Color Formatting turn each other off, and so do Show as Link and Show as Image.
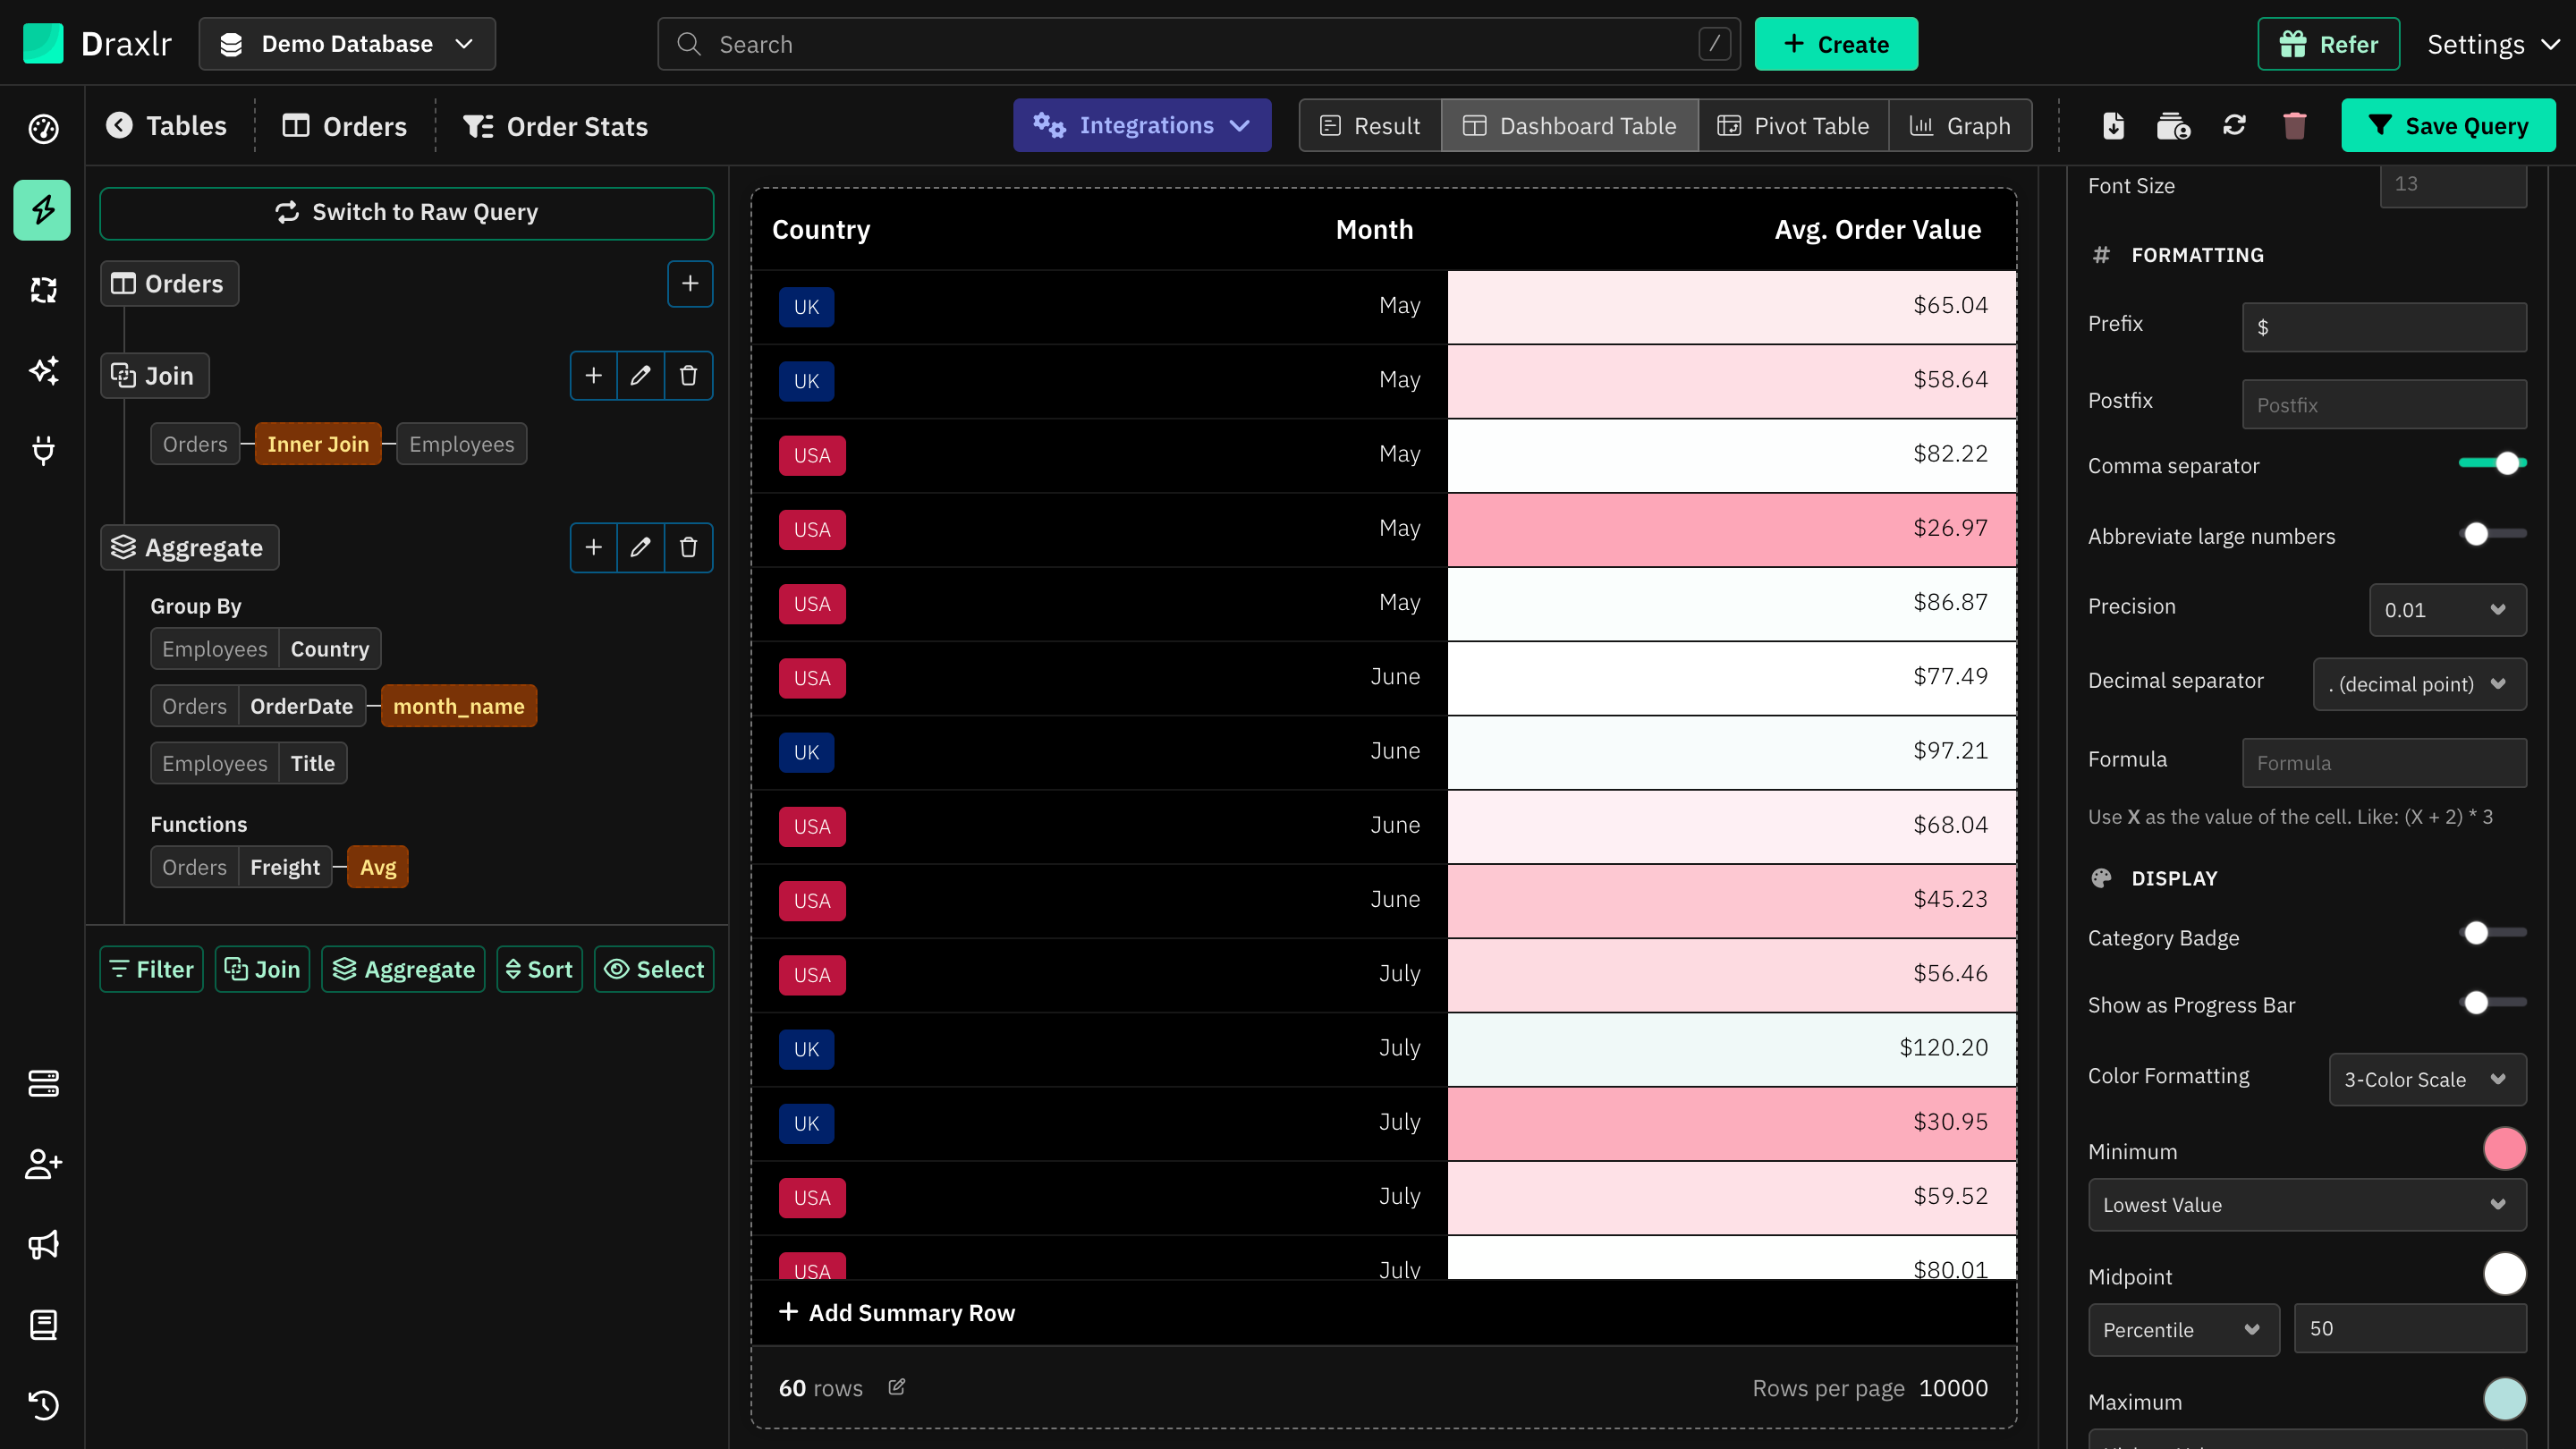
Color formatting
| Option | What it does |
|---|---|
| 5-Color Bands | Splits the column's range into five equal bands, 0% to 20% up to 80% to 100%, each with its own color. |
| 3-Color Scale | A smooth gradient between a Minimum, a Midpoint and a Maximum color. Set each point to Lowest Value or Highest Value, or to a Number, Percent or Percentile with a Value. The midpoint is the 50th percentile by default. |
| Single Color | Colors cells that meet a Condition, such as greater than 0. Pick the Condition Field to test, which can be another number column, the Condition Value and the Matching Color. Turn on Color Non-Matching Values to color the other cells too. |
| No Color | No color formatting. This is the default. |
The text color switches between black and white automatically so values stay readable.
Options
The Options tab has settings for the whole table:
| Setting | What it does |
|---|---|
| Background Color | The table's background. The text color adjusts to stay readable. |
| Show Borders | Shows cell borders. |
| Striped | Shades every other row. |
| Narrow | Uses less padding in each row. |
| Freeze First Column | Keeps the first column in place when you scroll sideways. |
| Hide Empty Columns | Hides columns that are empty in every row. |
| Font Size | Font size for all cells. |
| Header Font Size | Font size for the headers. If empty, it uses Font Size. |
| Highlight Row | Colors whole rows that match a rule. See below. |
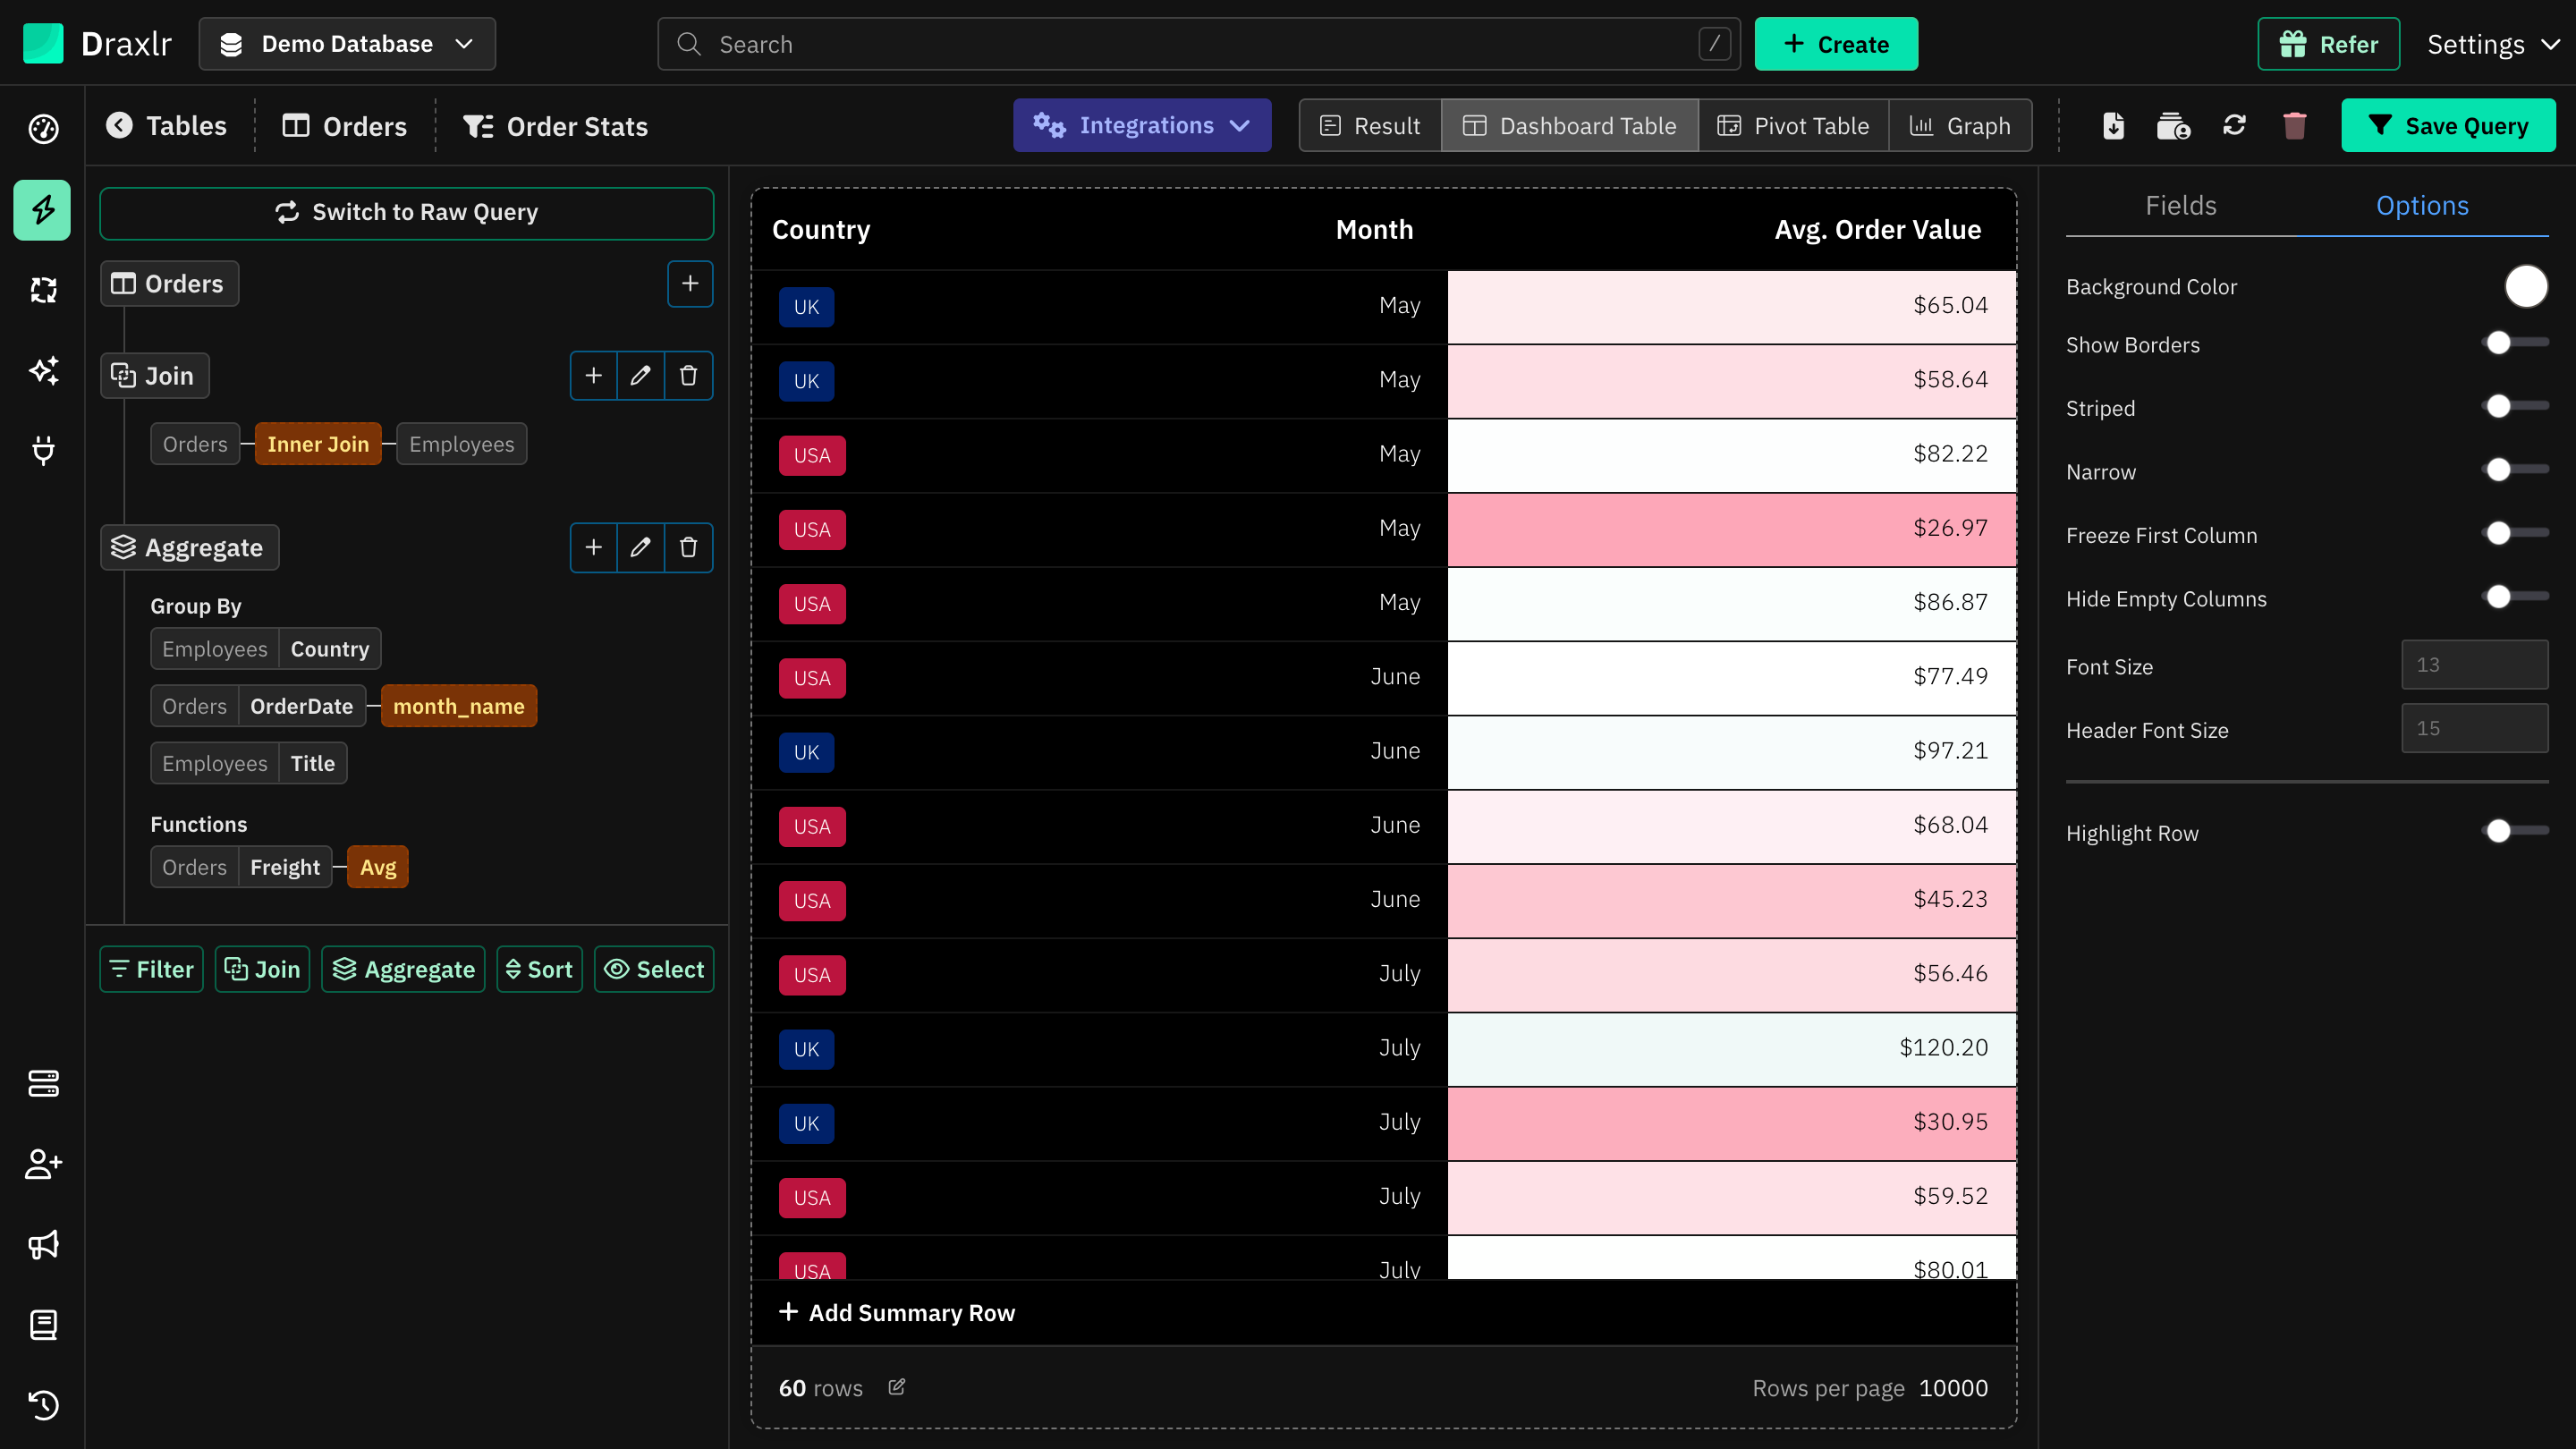
Highlight rows
Turn on Highlight Row to add a rule. For each rule, choose:
- Column: the column to check.
- Condition: Equals, Not Equal, Is Empty or Not Empty. Number columns add greater-than and less-than conditions, and date columns add After, On or After, Before and On or Before.
- Value: the value to compare with. Not needed for Is Empty and Not Empty.
- Highlight Color: the row's color.
Click Add Rule for more rules, or Remove to delete one. When a row matches several rules, the first one is used. Text must match exactly, including upper and lower case. A column's color formatting is shown on top of the row's highlight.
Summary row
Click Add Summary Row below the table to add totals or other calculations for each column. See Summary Row.
Things to know
- Current page only: progress bar targets, color bands and scales, and Hide Empty Columns are worked out from the rows on the current page.
- Saving: on a saved query, click Save Query to keep your changes. See How settings are saved.
- On dashboards: the element shows the table with these settings when its display type is Dashboard Table. Dashboard elements also add a search box. If you add a query saved as Result, the dashboard offers Result; use Customize Table to set up a Dashboard Table first.