Visualization > Pivot
Summarize a Draxlr query result in a pivot table, with row and column groups, aggregated values, totals, summary rows, number formatting and color scales.
A Pivot Table summarizes your query result by groups. Pick fields for the Columns and Rows, and the Values to add up in each cell. For example, count orders with employees as rows and countries as columns.
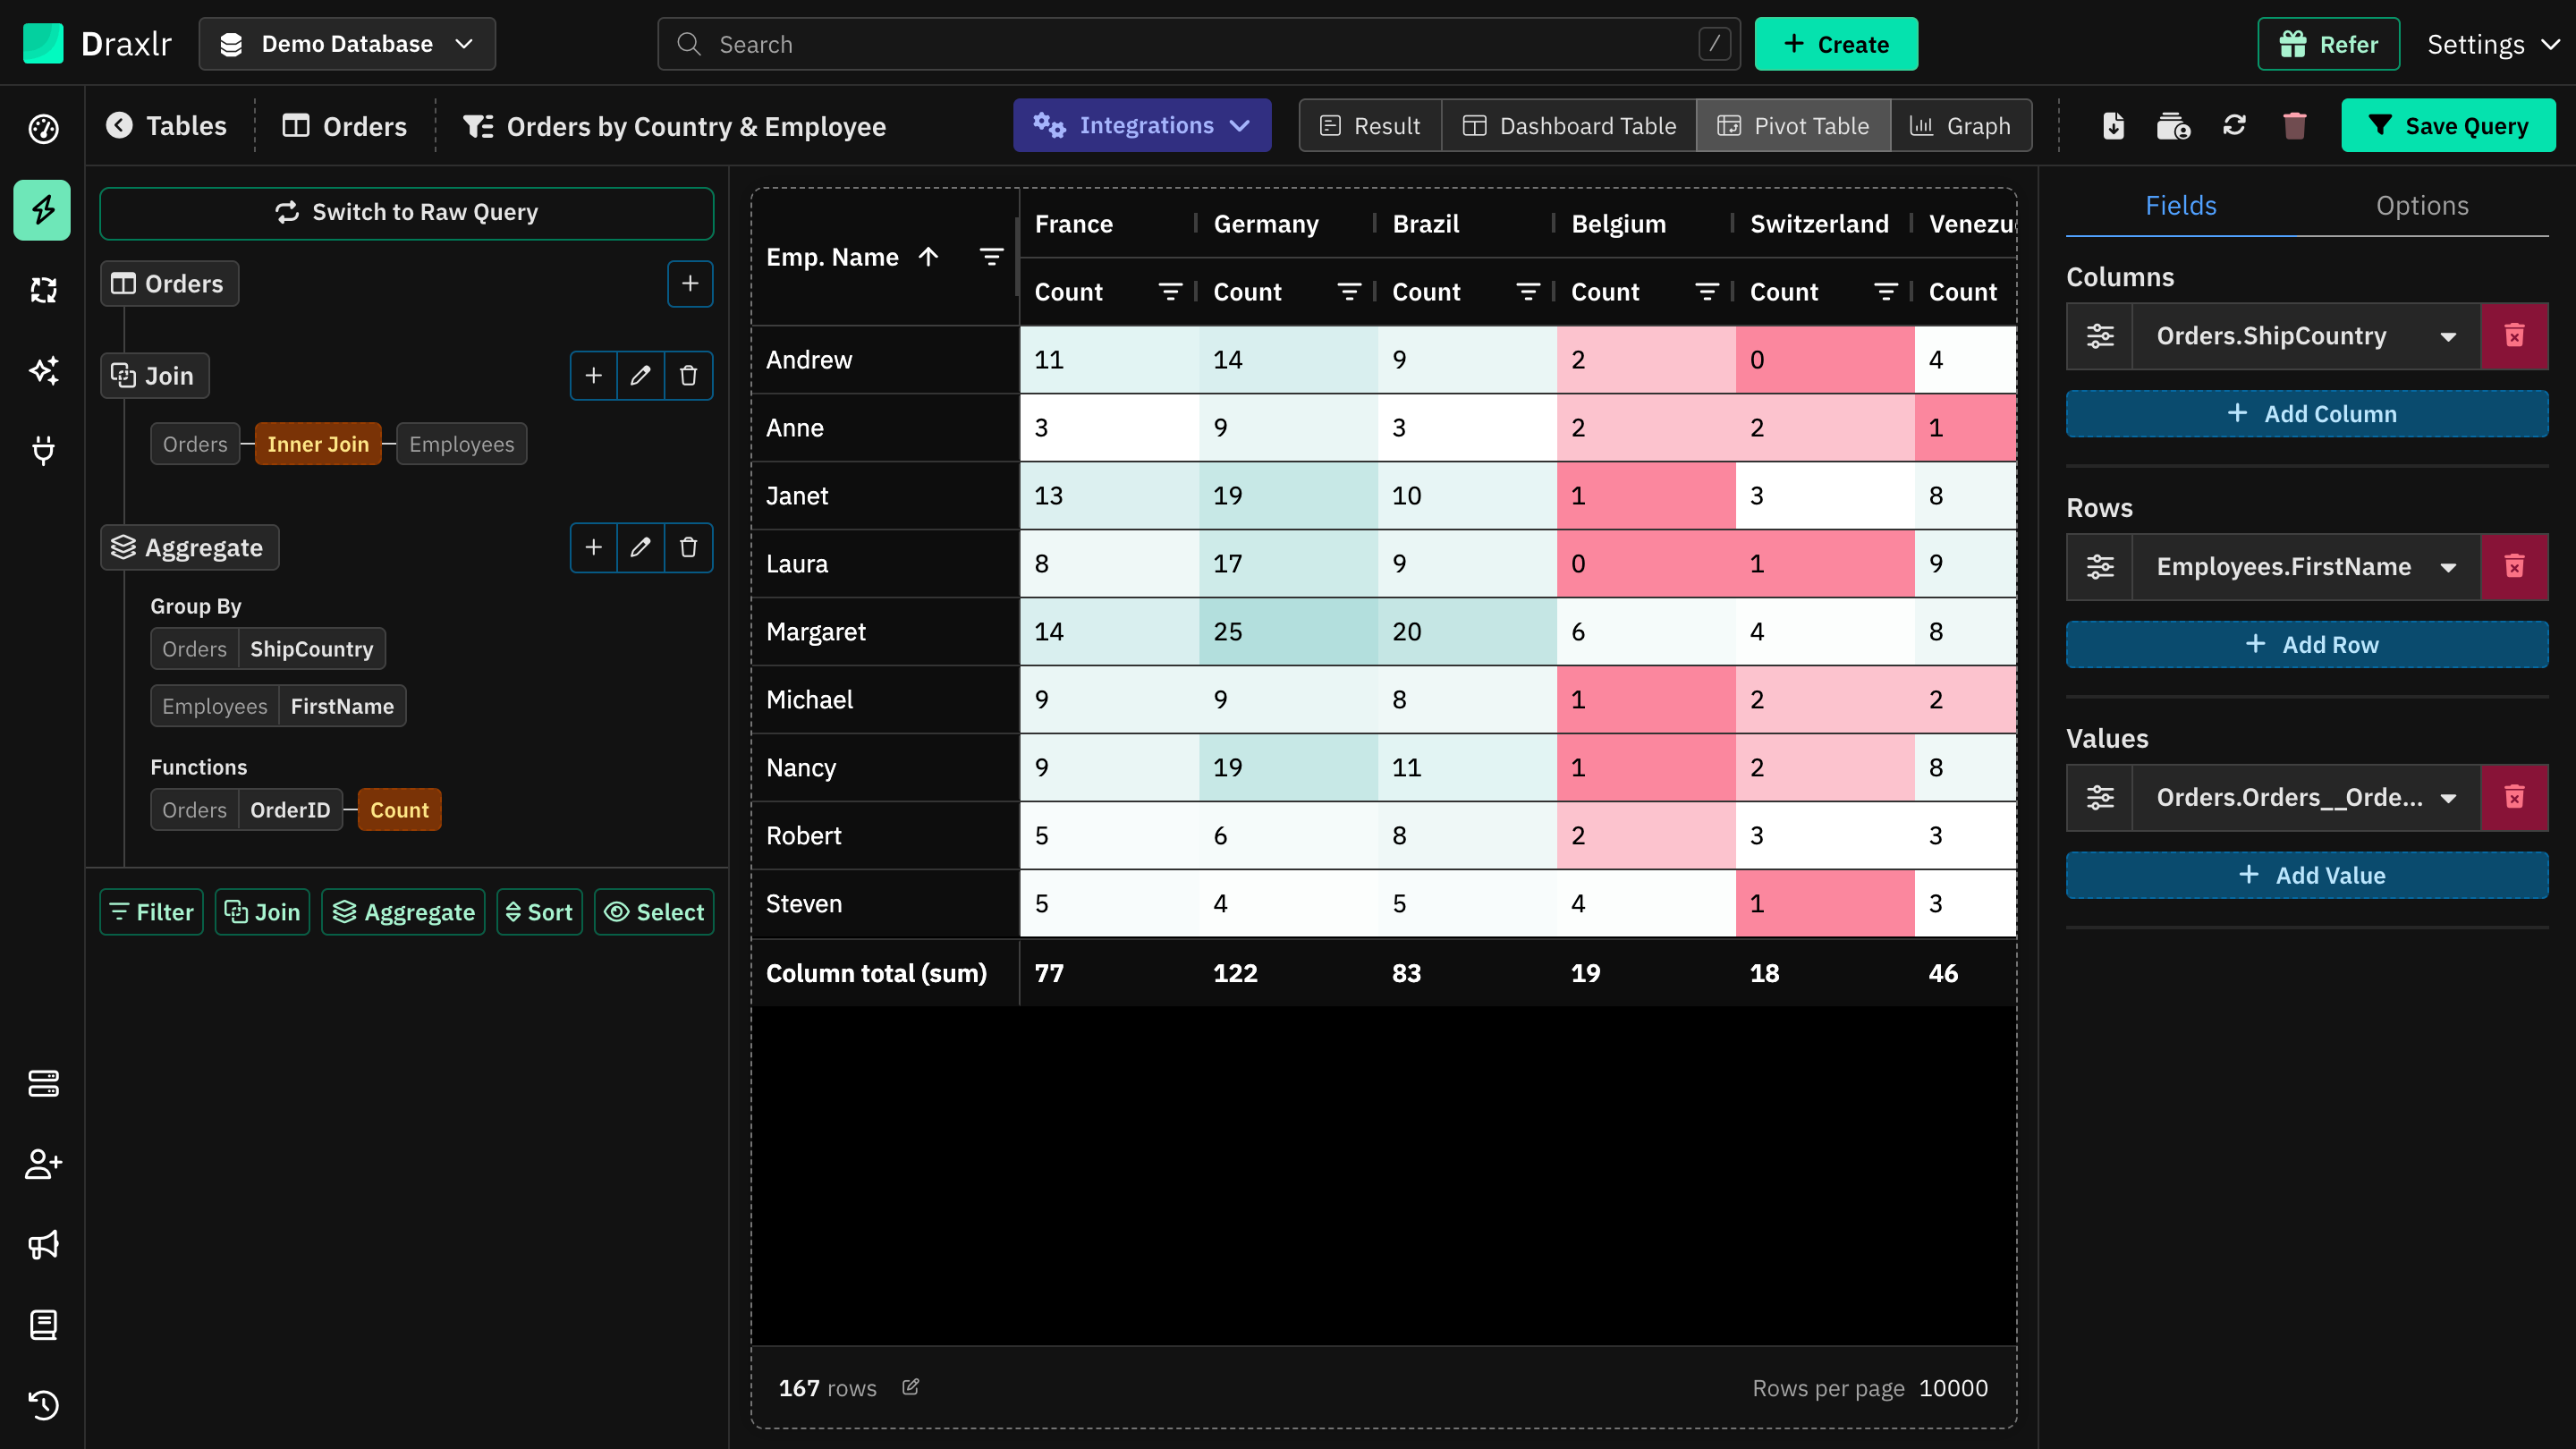
To use it, run a query in Browse Data and click Pivot Table at the top. It's available when the result has more than one value. The settings panel opens on the right with two tabs, Fields and Options.
Quick Pivot Table Generator
A pivot table needs grouped data. If your Query Builder query has no Aggregate step, Draxlr shows the Quick Pivot Table Generator instead:
Pick the fields
Choose a Column, a Row and a Value. For the value, pick an operation such as Count of rows, or Sum of, Average of, Min of or Max of a number column.
Click Generate Pivot Table
Draxlr adds an Aggregate step that groups by the column and row, runs the query, and fills in the pivot table. Date columns are grouped by month.
Raw SQL queries skip the generator. The pivot table uses the columns your SQL returns.
Fields
The Fields tab has three sections. Click Add Column, Add Row or Add Value to add a field, and the trash icon to remove one.
| Section | What it does |
|---|---|
| Columns | Each value of the field becomes a column header. With more than one field, the headers are nested. |
| Rows | Each field becomes a column on the left, and each value a row. Rows are sorted in ascending order. |
| Values | The numbers shown in each cell, combined for every row and column pair. |
The table needs at least one column or row field and at least one value. When you first open it, Draxlr fills the fields from your result: text columns go to Columns and Rows, and number columns to Values.
Field options
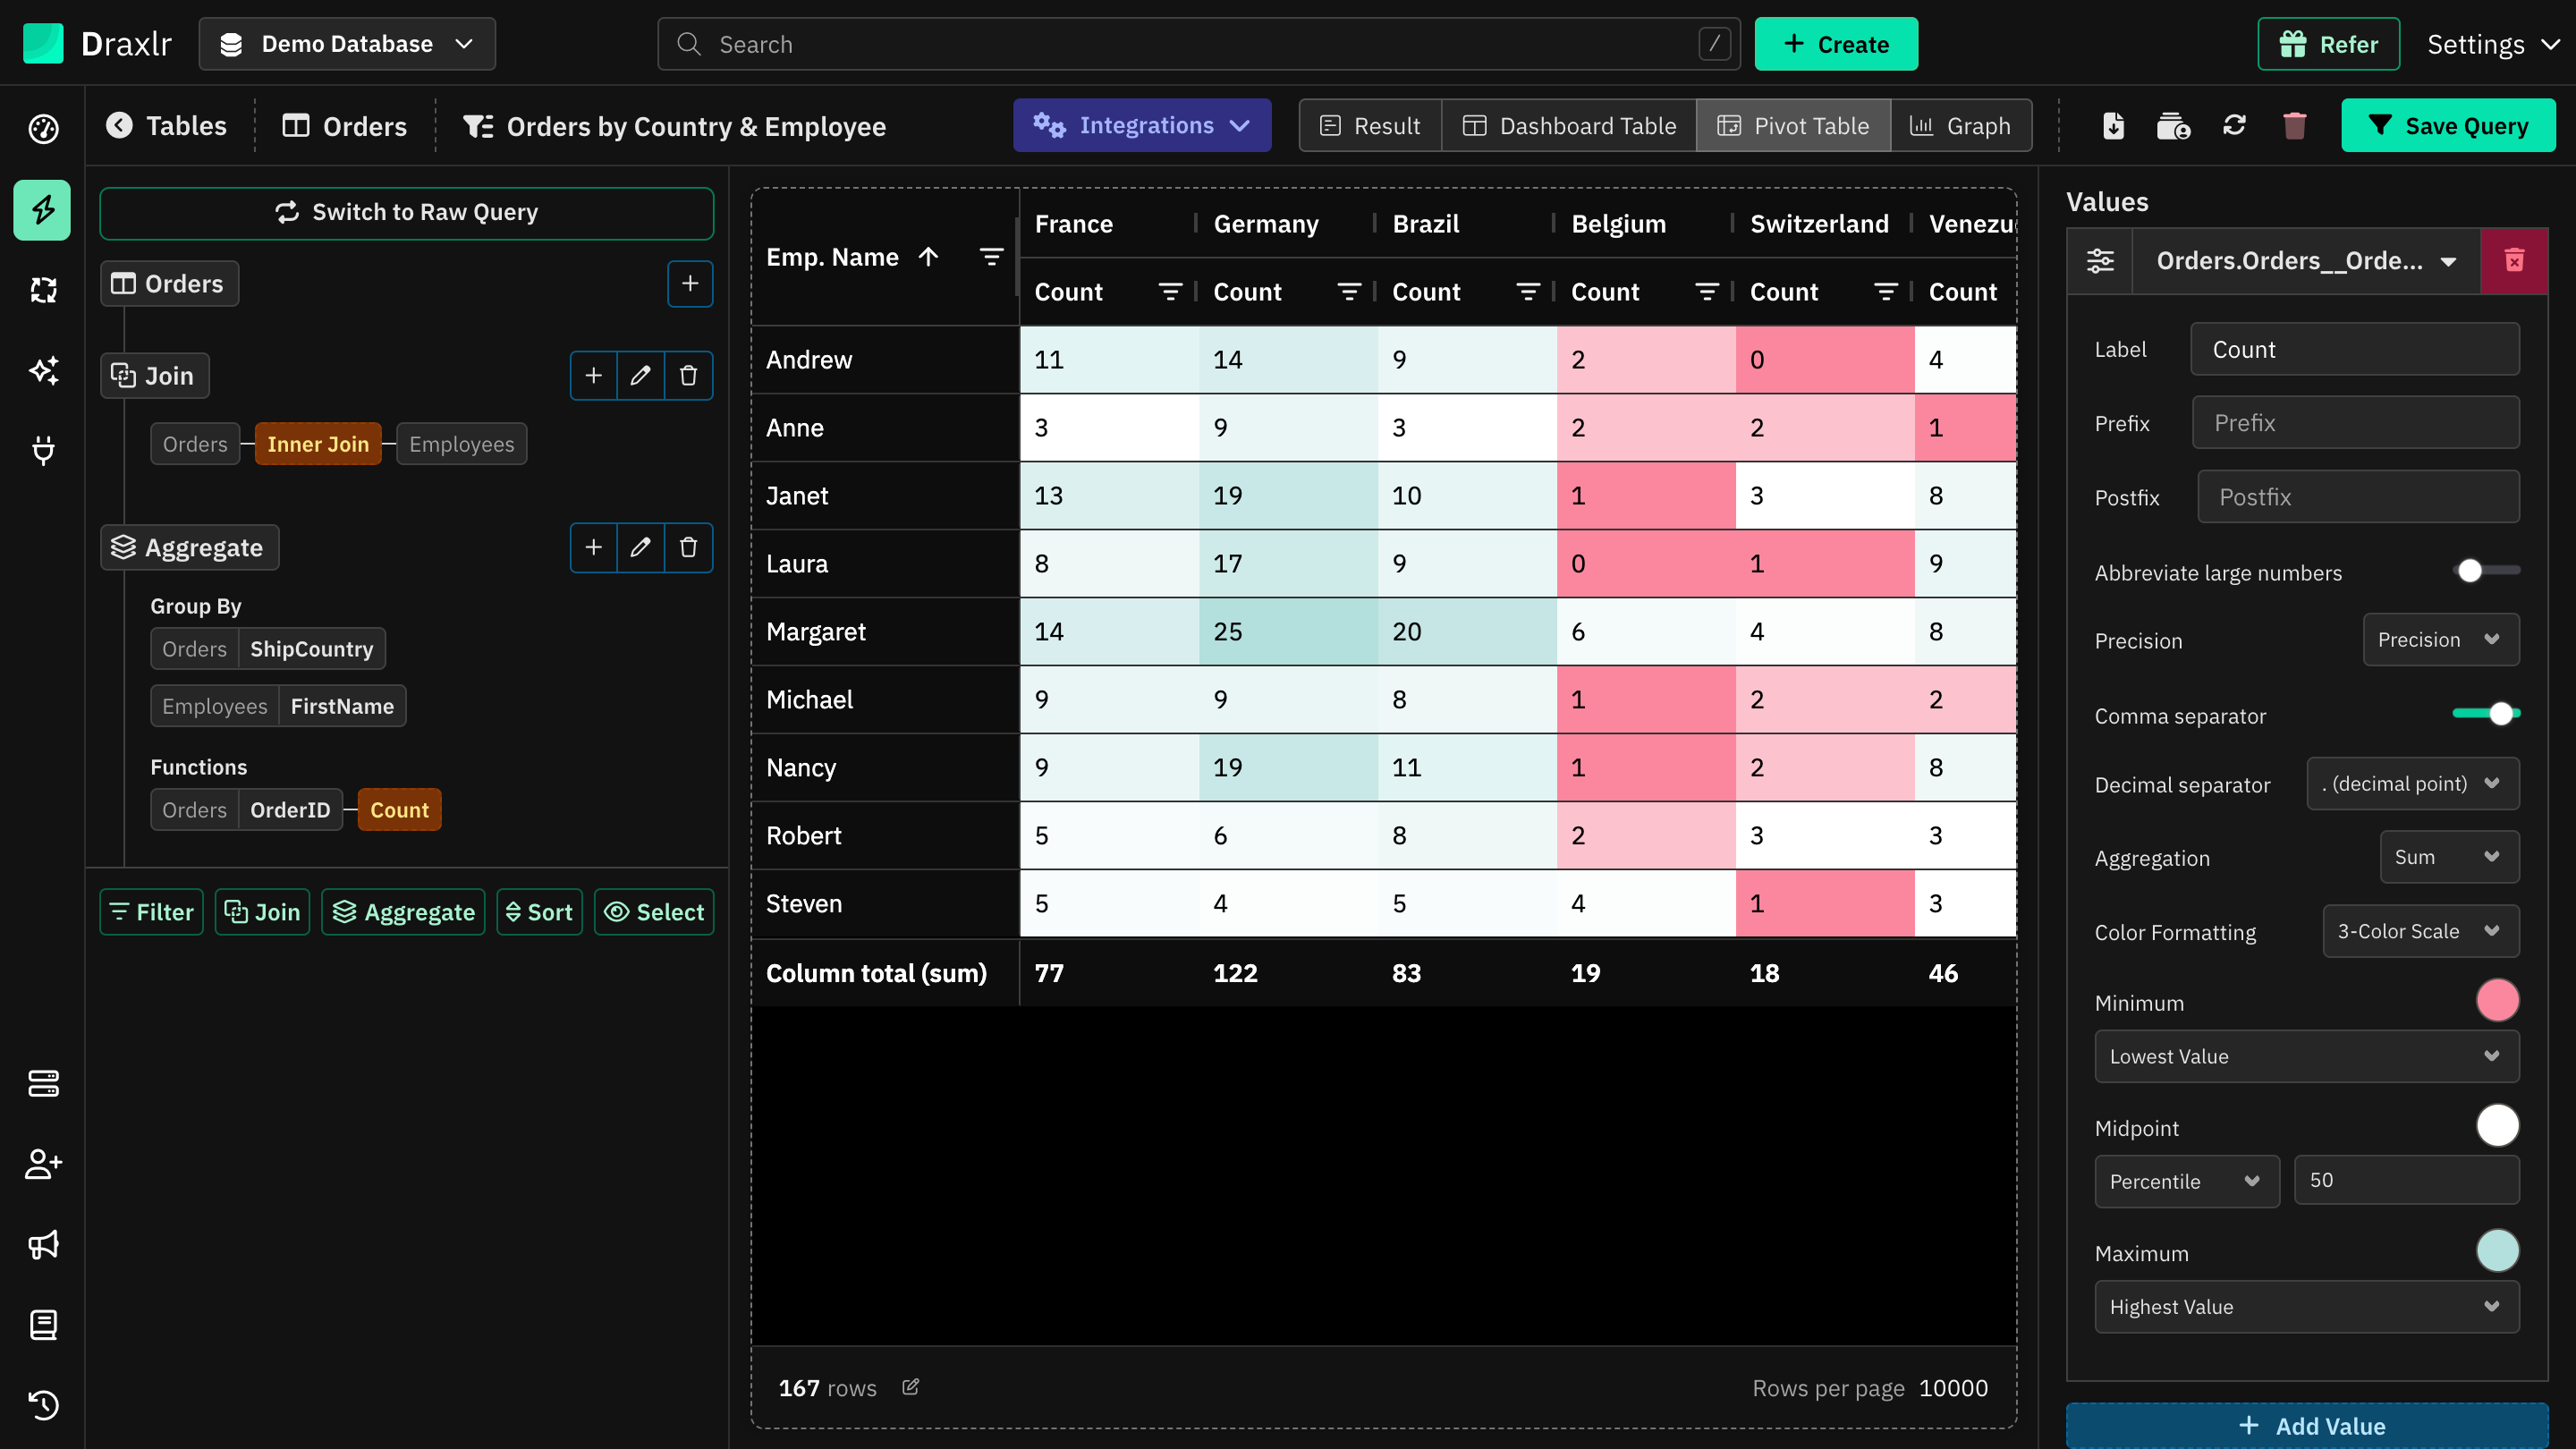
Click the sliders icon (Customise) next to a field to open its options.
Rows and Columns
| Setting | What it does |
|---|---|
| Label | Renames the row's header. Rows only. |
| Date formatting | Turn on to pick a Date Format, such as 15 Feb, 2026, Q1 2026, Feb or Monday. Rows are grouped by the formatted date, so Feb puts February from every year together. |
| Show Summary Row | Adds a subtotal row for each group, such as North (sum). Rows only, and needs at least two row fields. |
| Add empty line below summary | Adds a blank line after each summary row. |
Values
| Setting | What it does |
|---|---|
| Label | Renames the value's header. |
| Prefix, Postfix | Text added before or after each number, such as $. |
| Abbreviate large numbers | Shows large numbers in short form, such as 1.2K. |
| Precision | The number of decimal places. Leave it on Precision to keep the value's own decimals. |
| Comma separator | Adds thousands separators. On by default. |
| Decimal separator | . (decimal point) or , (comma). Shown when Comma separator is on. |
| Aggregation | How rows are combined in a cell: Sum (default), Average or Count. |
| Color Formatting | Colors cells by value: 5-Color Bands, 3-Color Scale, Single Color or No Color (default). These work the same as in a Dashboard Table. Totals aren't colored. |
Number formatting applies to every cell of the value, including totals.
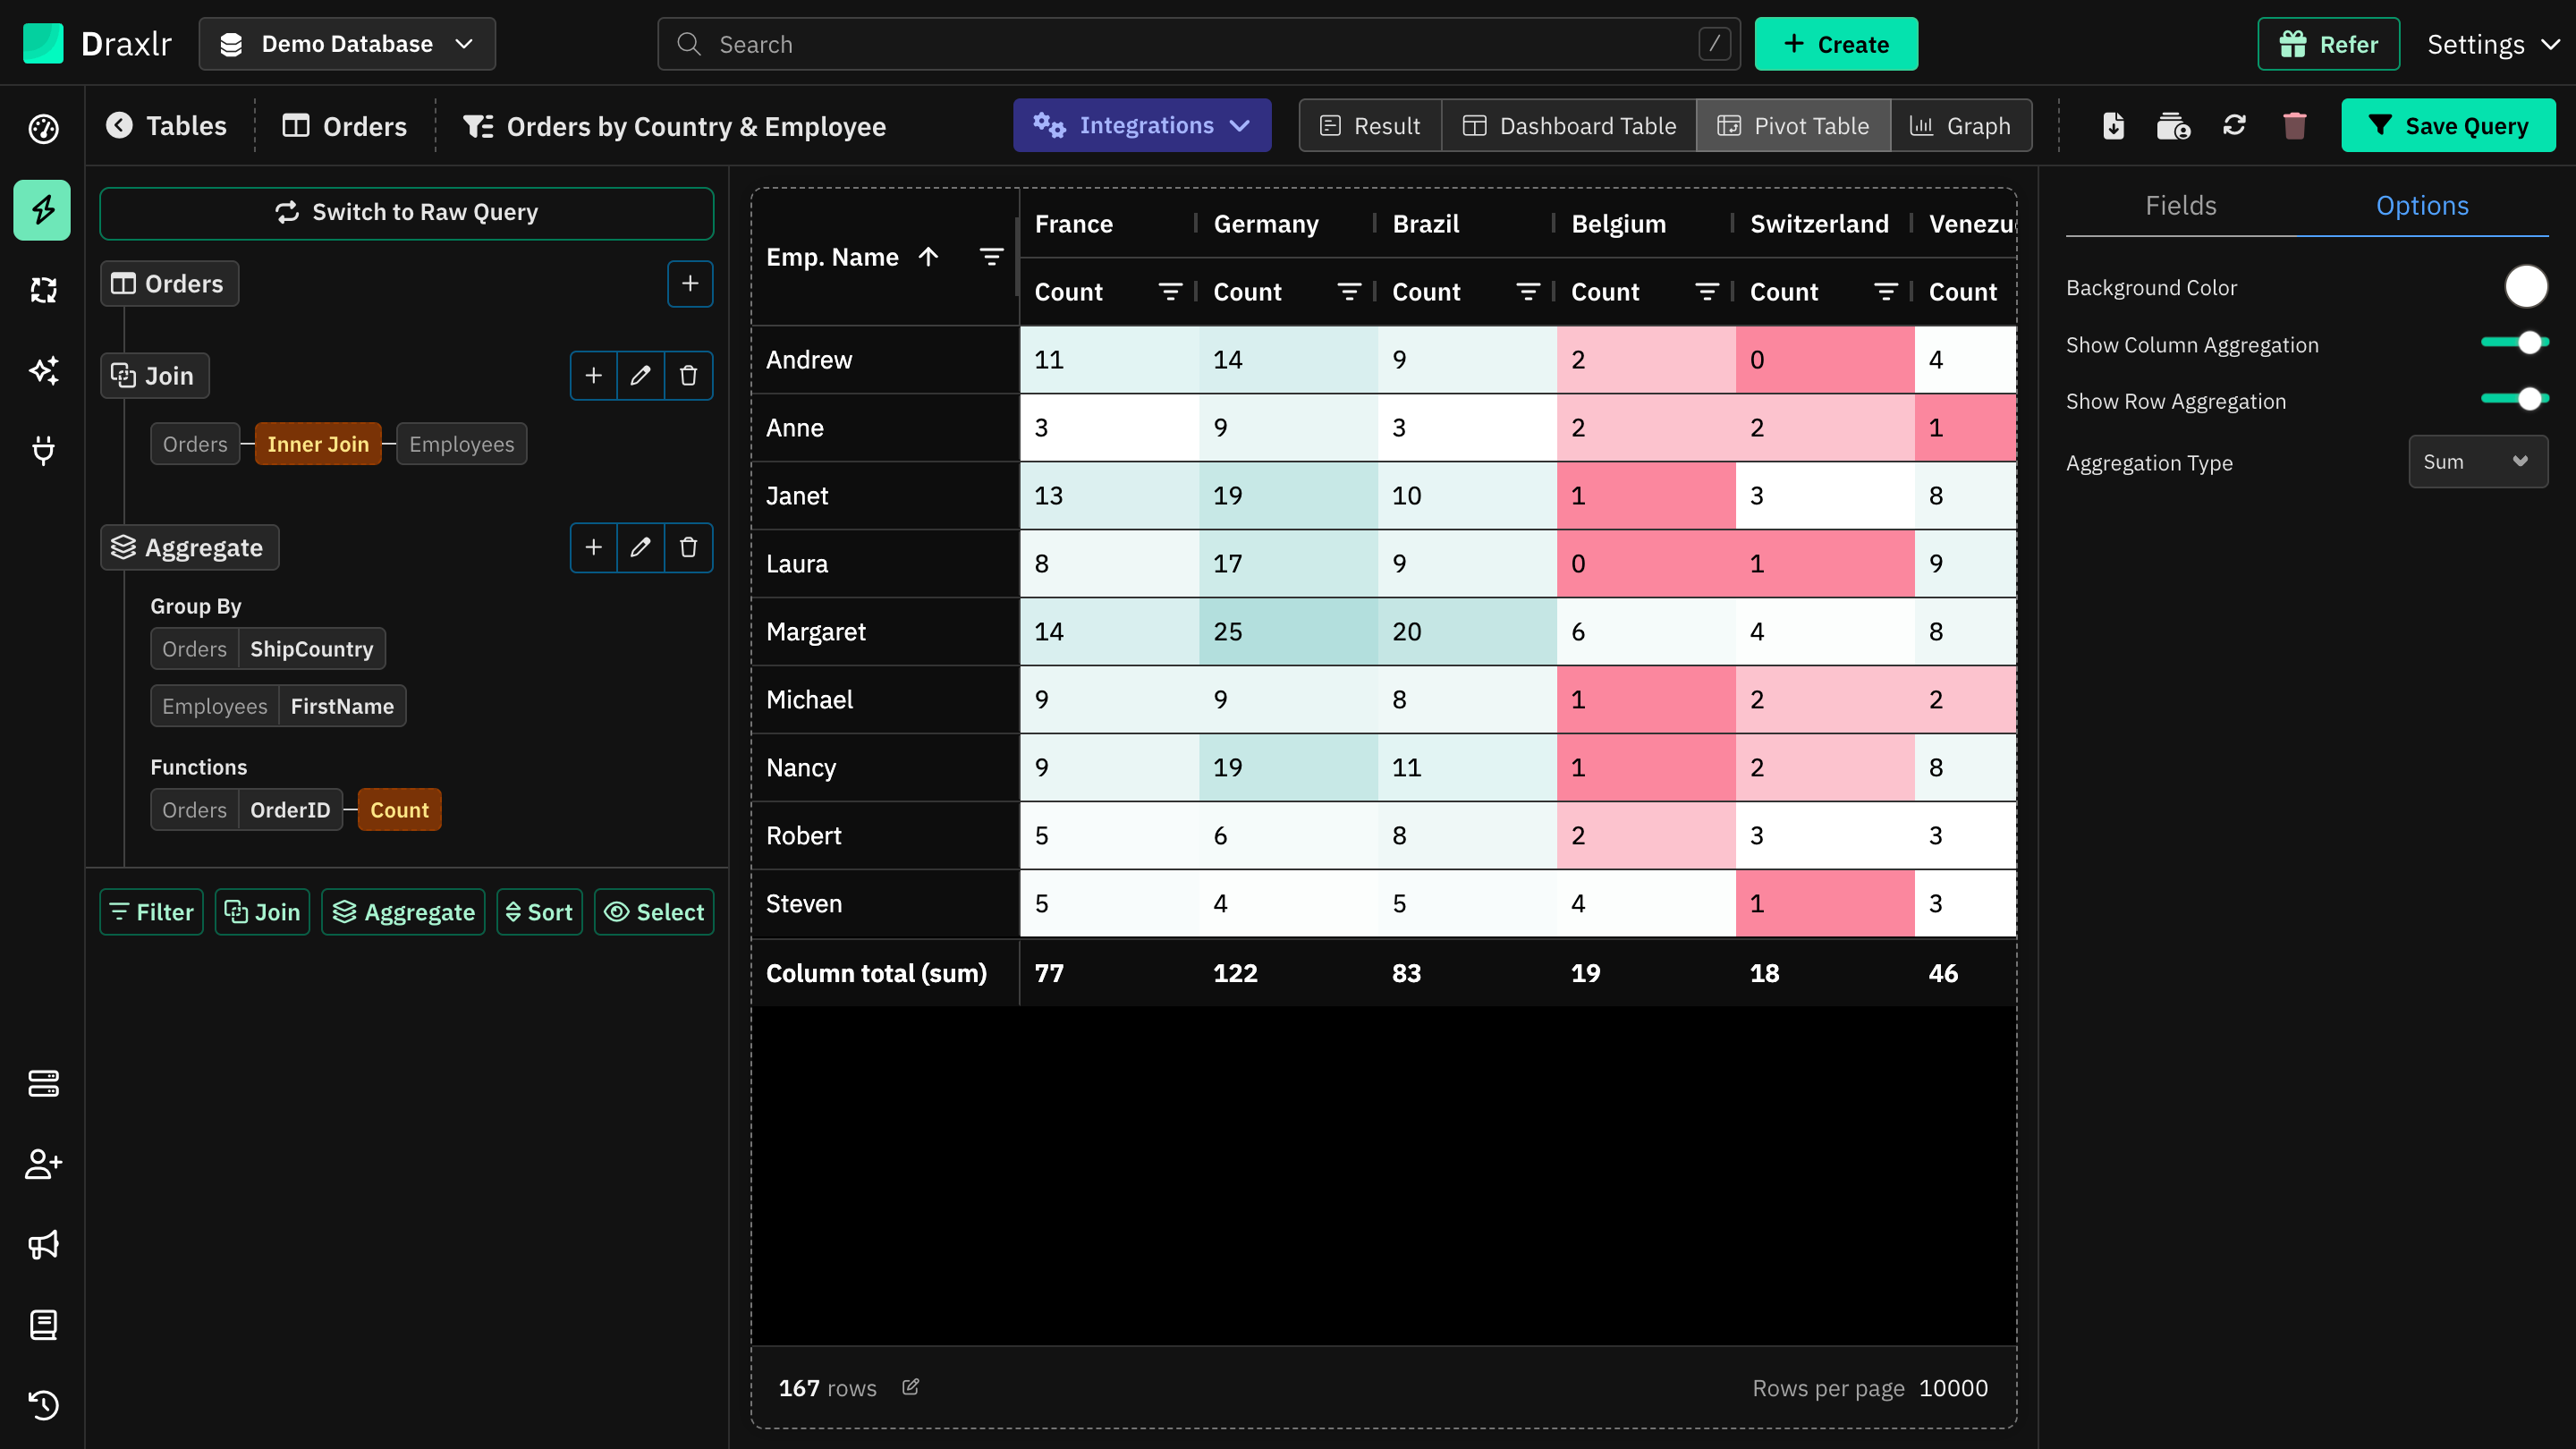
Options
| Setting | What it does |
|---|---|
| Background Color | The table's background. Headers are drawn slightly darker, and the text color adjusts to stay readable. |
| Show Column Aggregation | Adds a Column total row at the bottom. On by default. |
| Show Row Aggregation | Adds a Row total column on the right. On by default. |
| Aggregation Type | How totals and summary rows are worked out: Sum (default), Average, Min or Max. |
Use the pivot table
- Sort: click a column header.
- Filter: use the filter icon on a value column. The column total updates to match.
- Resize: drag a column's edge. With nine or more columns, the row labels stay fixed on the left while you scroll.
- See the rows behind a cell: click a value to open the rows behind it. Click Back to previous Query to return to the pivot table.
Things to know
- Current page only: the pivot table is built from the rows on the current page. If the result has more rows than Rows per page, raise it at the bottom of the table so every row is counted.
- Empty cells: a row and column pair with no data shows 0. Blank group values show as (Empty).
- Totals use the cells: an Average total is the average of the cell values, not of the original rows.
- Saving: on a saved query, click Save Query to keep your changes. See How settings are saved.
- On dashboards: the element shows the pivot table with these settings. Clicking a cell opens a drill down.