Query Builder > Aggregate
Aggregate your SQL Data
Draxlr’s Aggregate feature lets you summarize and analyze your data using SQL-style Group By and aggregate functions—all without writing code.
Use it to count, sum, average, and perform other calculations over groups of data directly in your Explore workflow.

How to Use the Aggregate Feature?
-
Open the Aggregate Modal
- Click on Aggregate in the left sidebar.
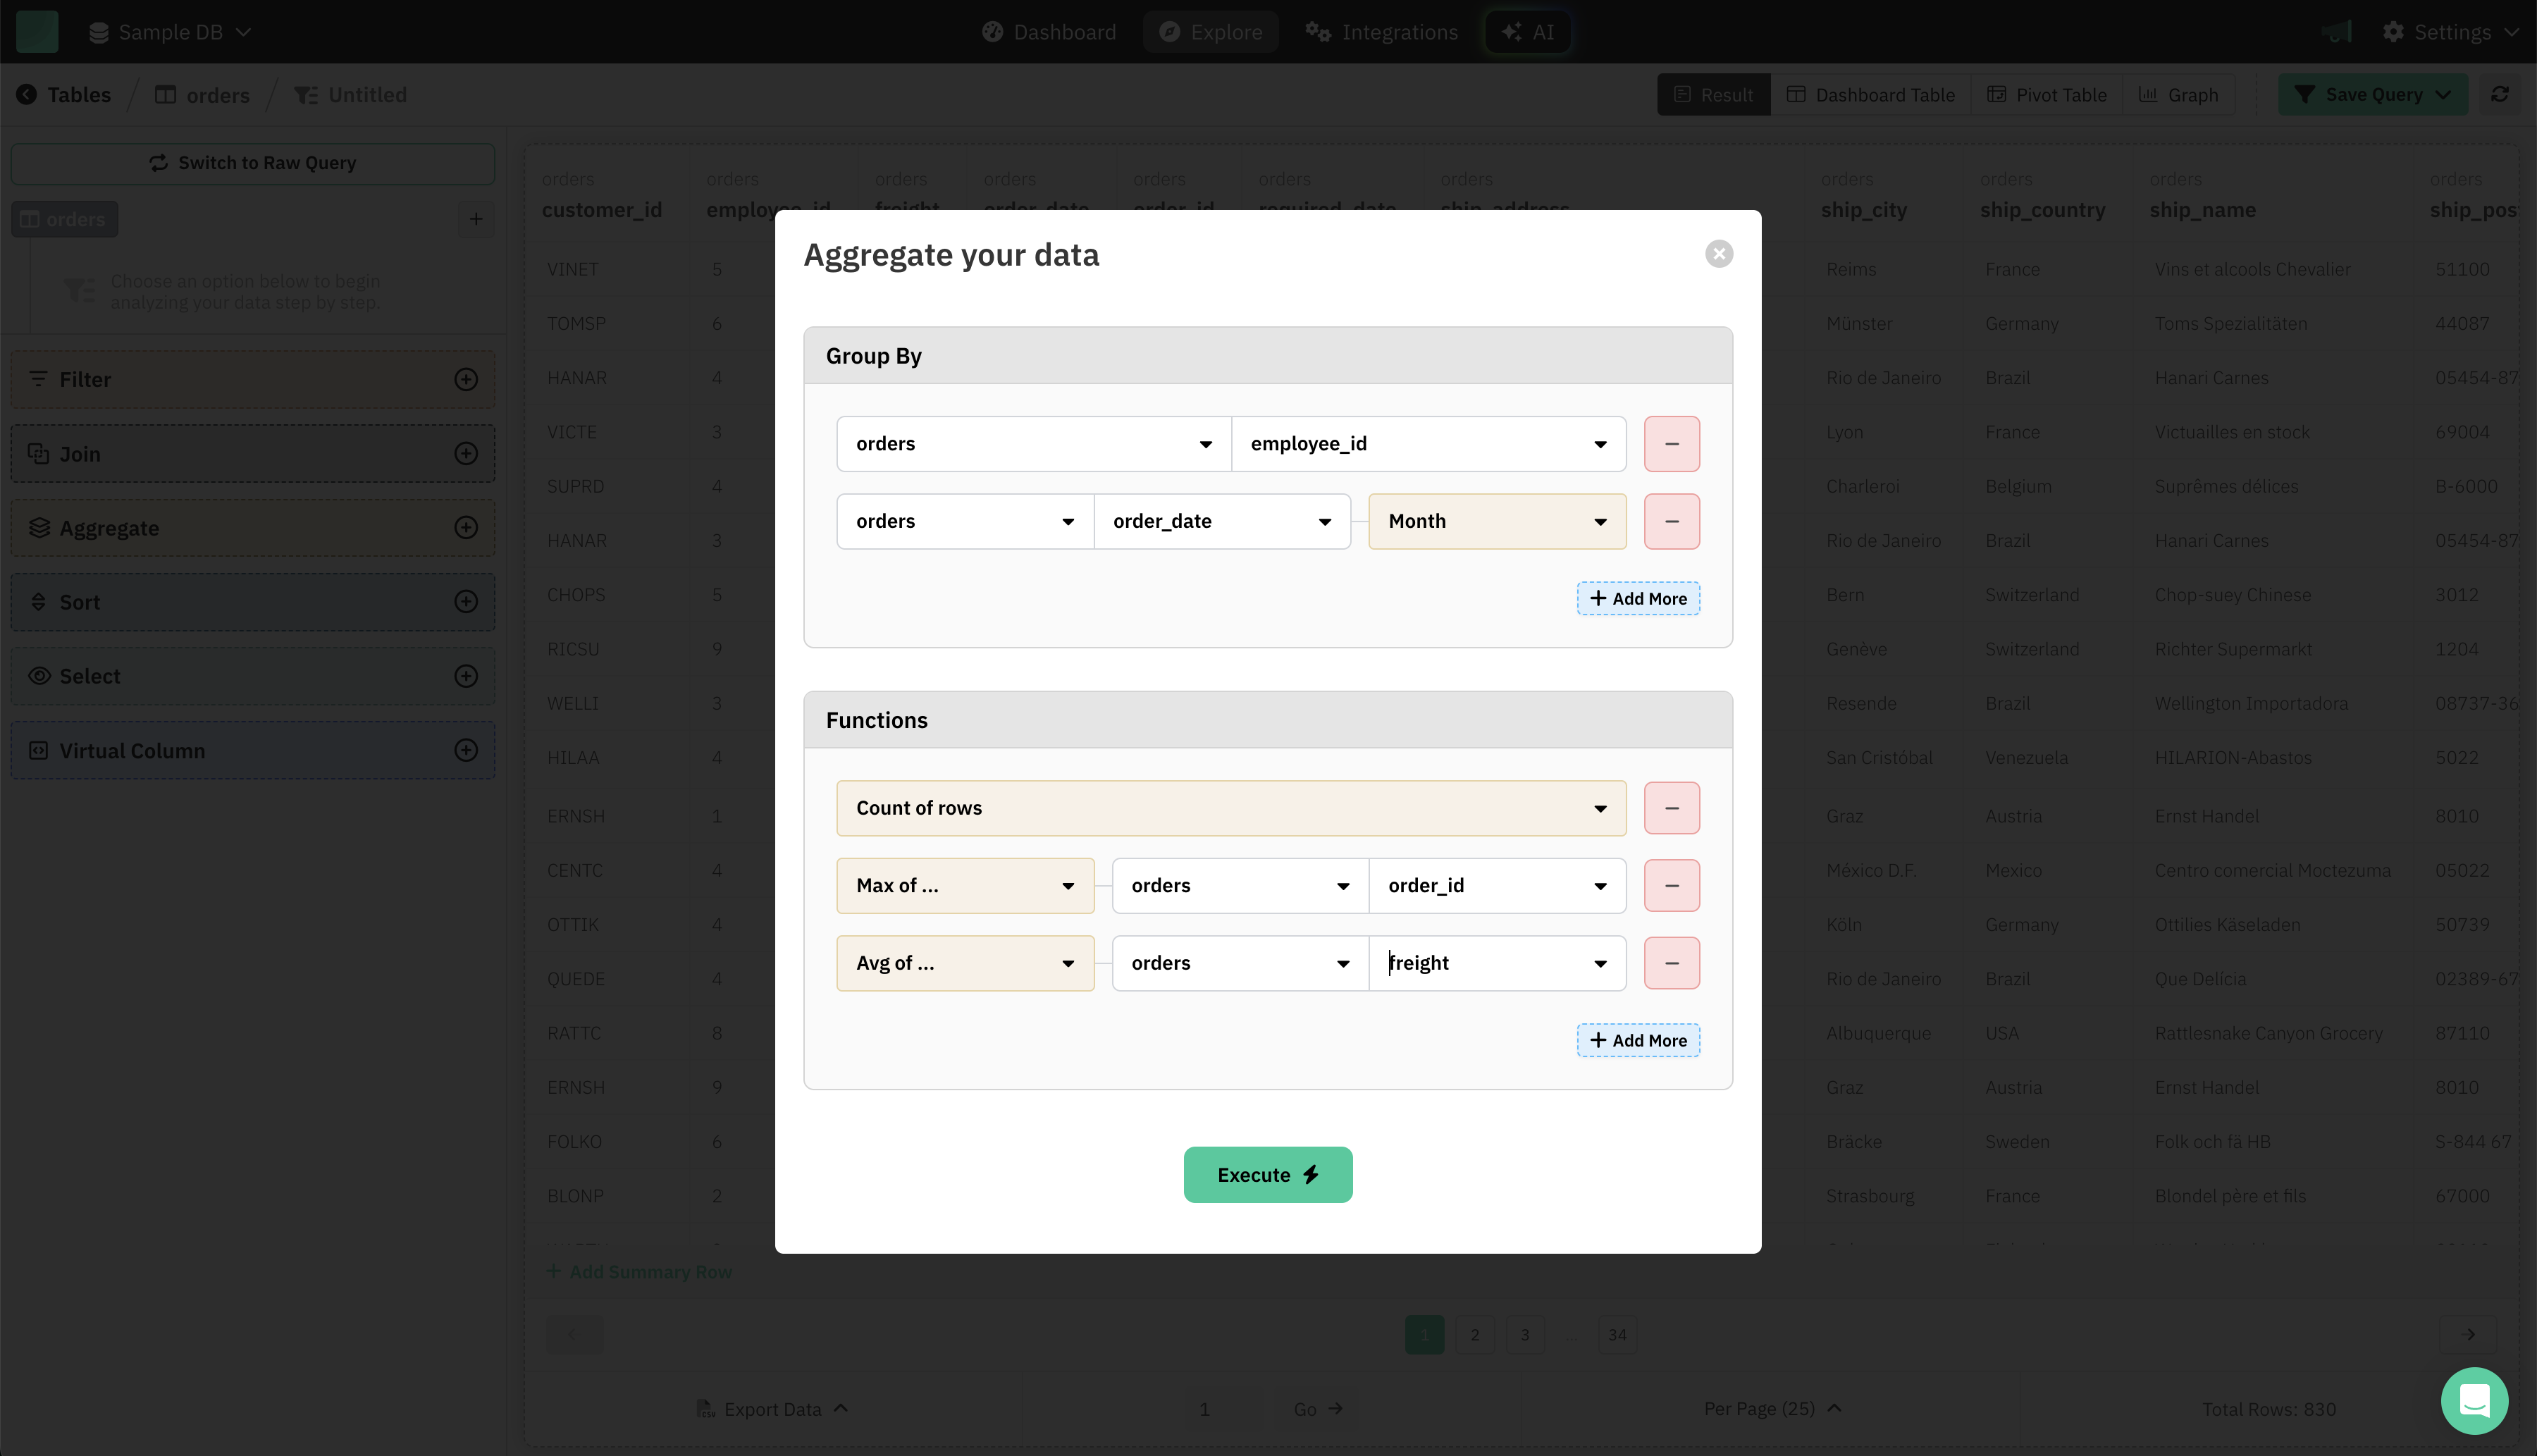
- The "Aggregate your data" dialog will appear.
-
Set Up Group By Rules
- In the Group By section, choose:
- Table: Select the relevant table (e.g.,
orders). - Column: Choose the column you want to group by (e.g.,
employee_id). - Interval (optional): For date fields, you can select intervals like Month, Year, Day, etc. (e.g., group
order_dateby Month).
- Table: Select the relevant table (e.g.,
- Click + Add More to add multiple grouping fields.
- Remove a group by clicking the – button.
- In the Group By section, choose:
-
Add Aggregate Functions
- In the Functions section, define what you want to calculate for each group:
- Count of rows: Total number of rows in each group.
- Count of ...: Number of non-null values in a column.
- Distinct count of ...: Number of unique values in a column.
- Min/Max of ...: Minimum or maximum value in a column.
- Avg of ...: Average value in a column.
- Sum of ...: Total sum of values in a column.
- For each function, select the operation, table, and field.
- Add more functions with + Add More. Remove any with the – button.
- In the Functions section, define what you want to calculate for each group:
-
Run the Aggregation
- Once your Group By and Functions are set, click Execute.
- Your table will update, showing results for each group and the computed values.
Tips
- Multiple Groupings: Combine several fields for advanced breakdowns.
- Date Intervals: Summarize data by month, year, day, and more.
- Flexible Functions: Mix and match count, sum, average, min, max, and distinct counts.