Query Builder > Table Header Actions
Table Header Actions on your SQL Data
Draxlr offers powerful actions right from your table column headers, making it easy to sort, visualize, and summarize your data with a single click.
Each column header reveals a context menu with three main features:
- Sort
- Distribution
- Summarize
1. Sort
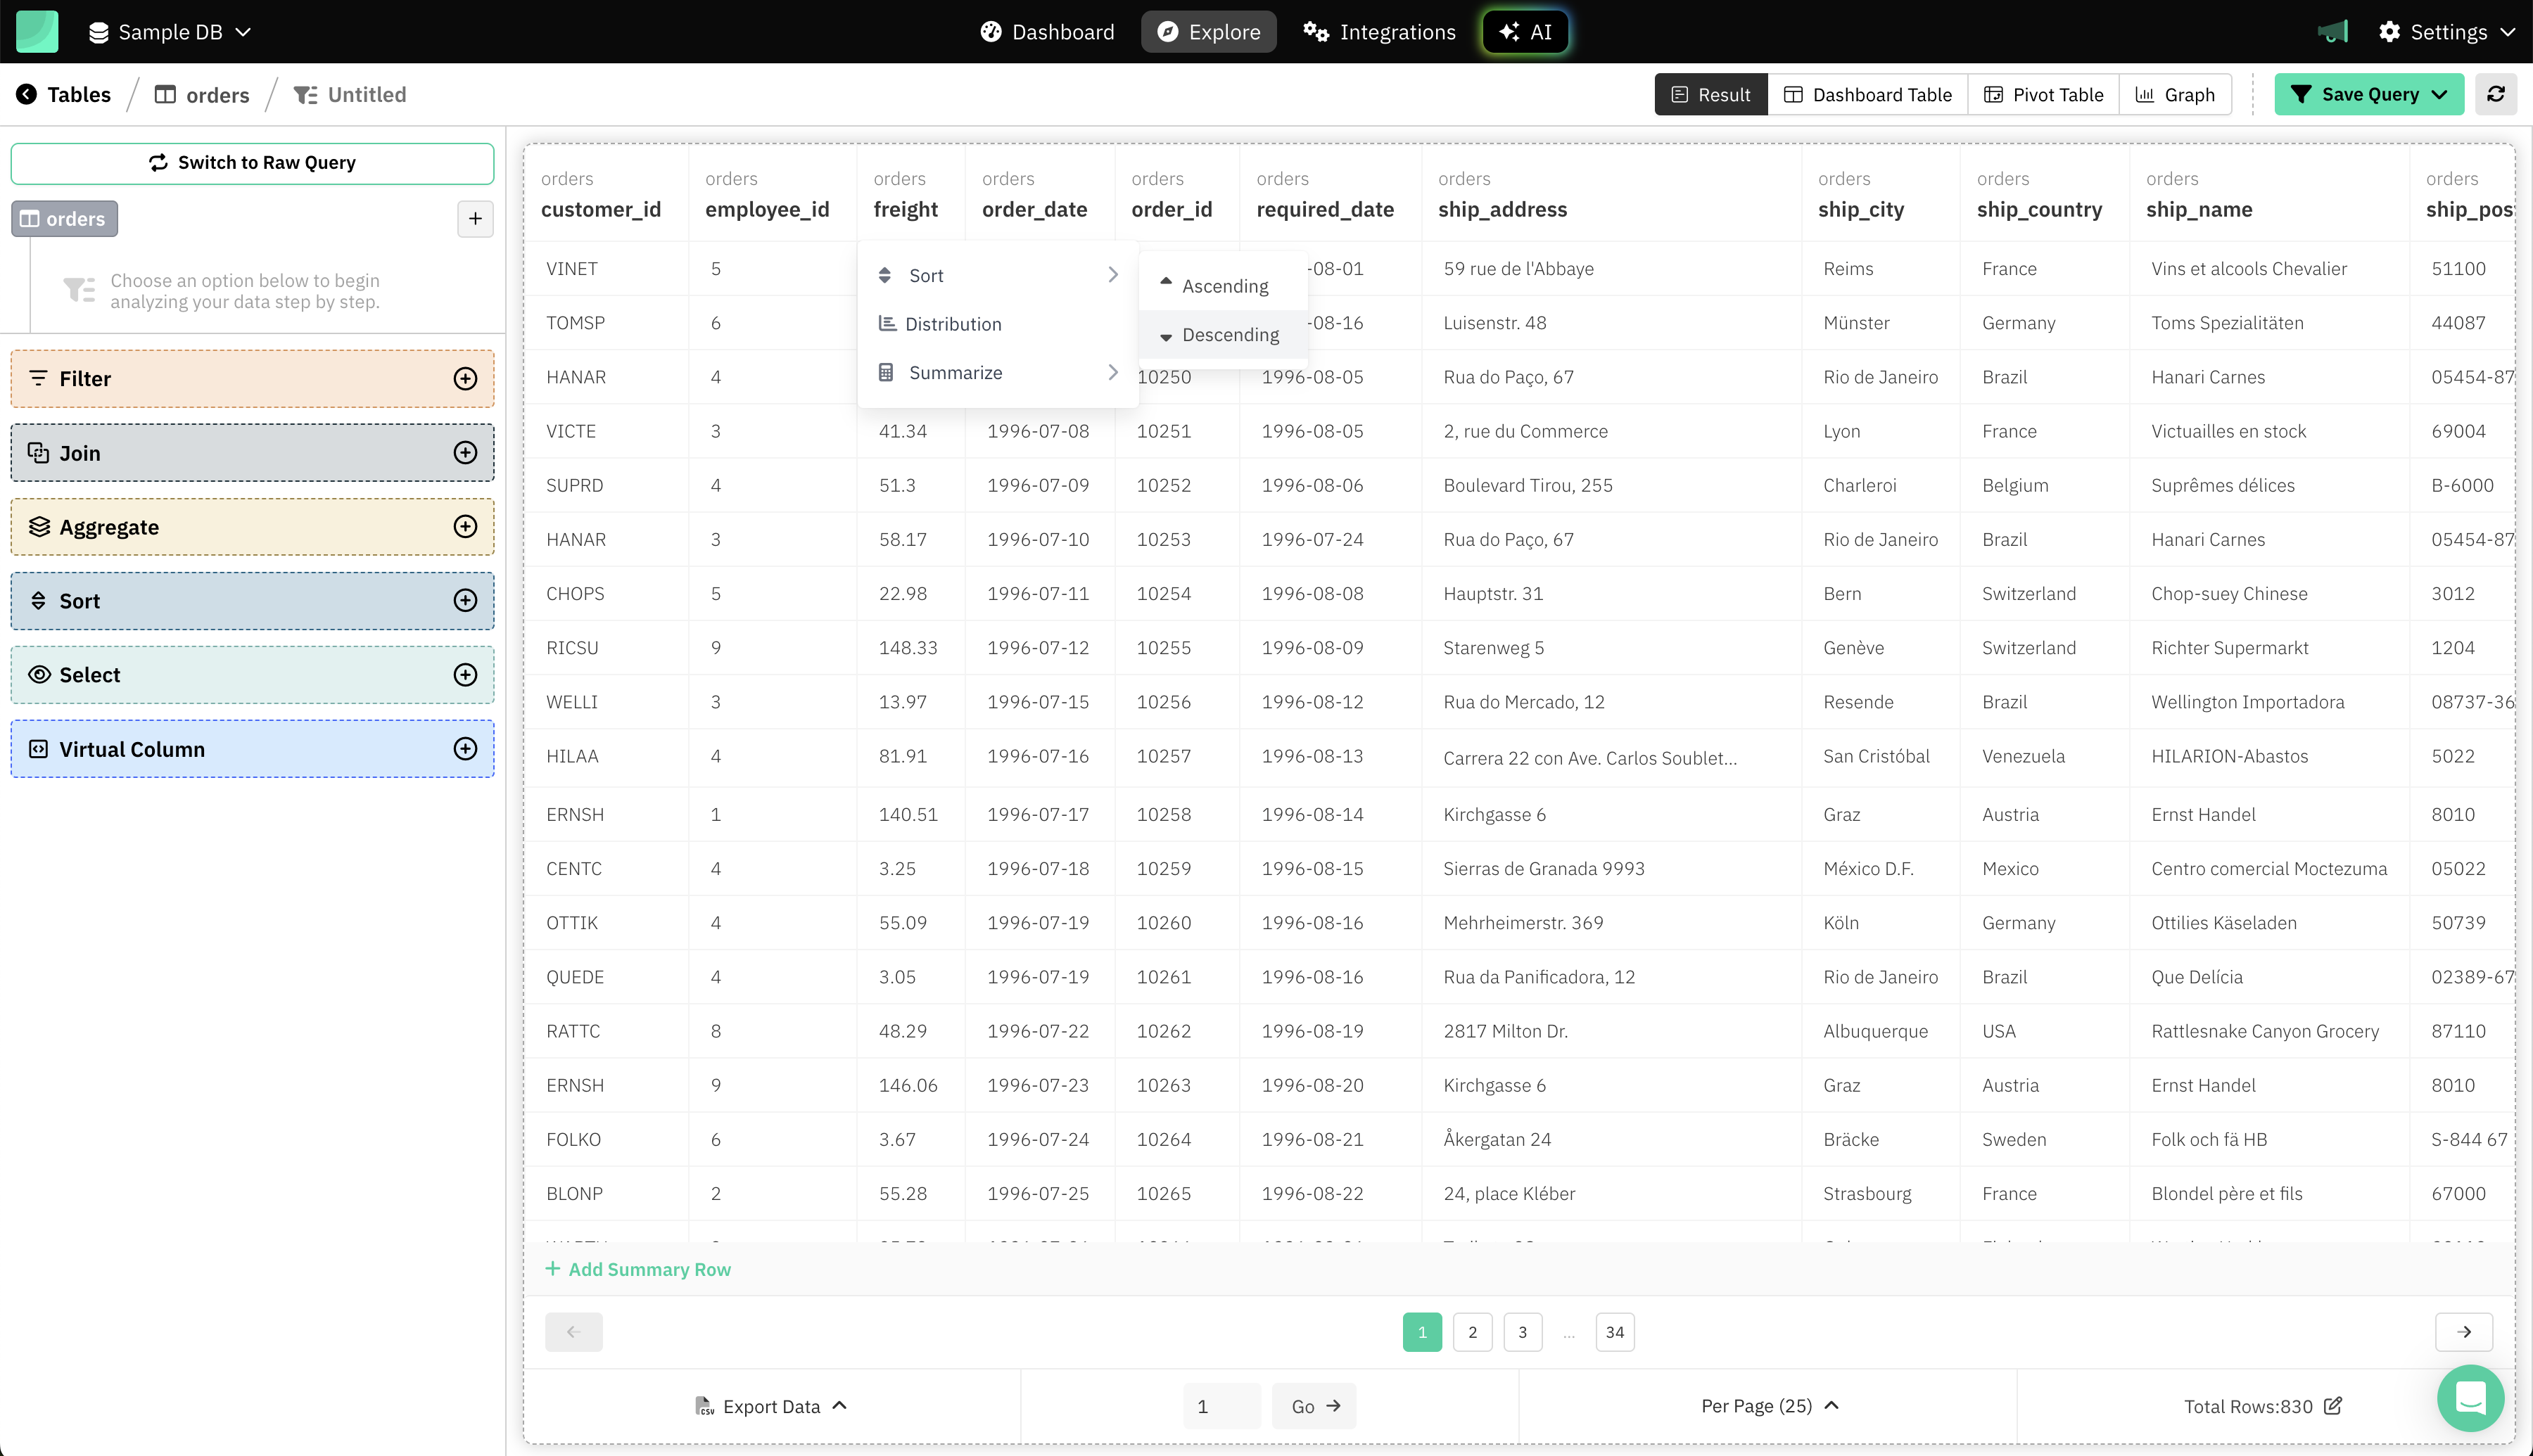
Quickly reorder your data by any column:
-
Click on any column header to see the dropdown.
-
Choose Sort > Ascending or Sort > Descending to sort your table by that field.

2. Distribution
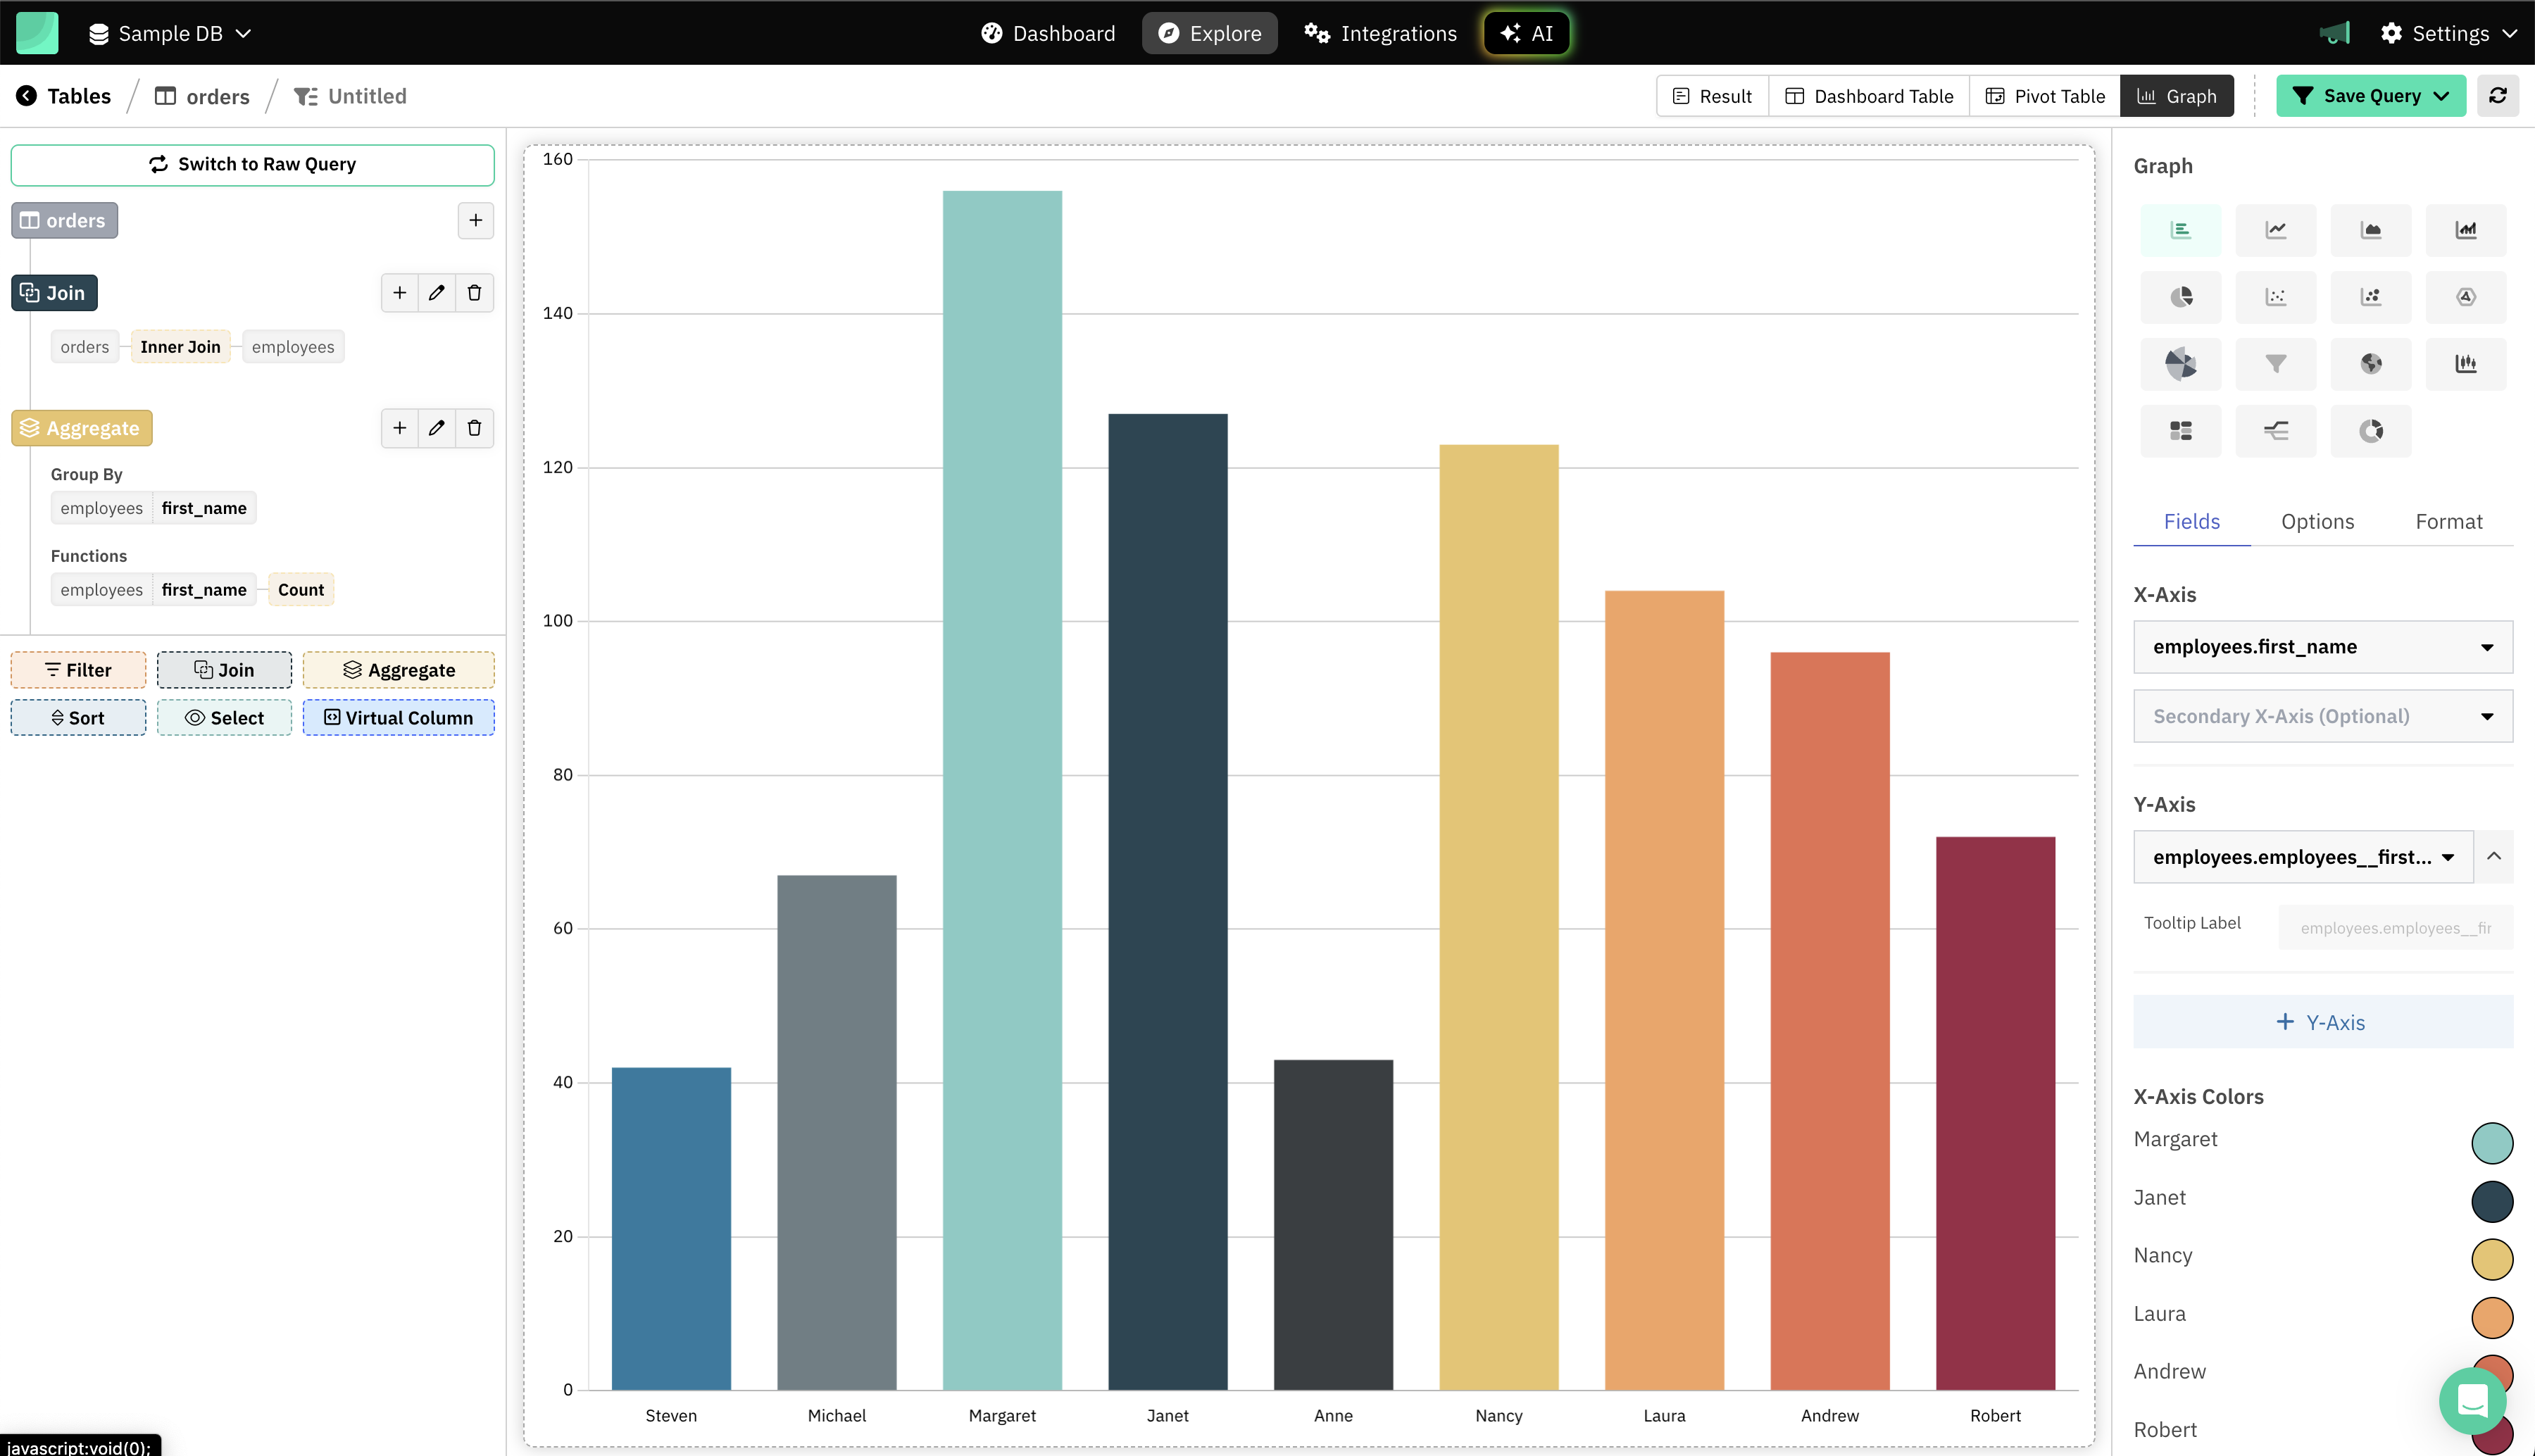
Instantly visualize the distribution of values in any column:
-
What it does:
Creates a bar chart that shows a group by of the selected field, with a count of occurrences for each unique value. -
How to use:
Click the column header, then choose Distribution.
A bar graph will be generated, grouping your data by that field and counting rows for each group.
3. Summarize
Get quick summary statistics for any column:
-
What it does:
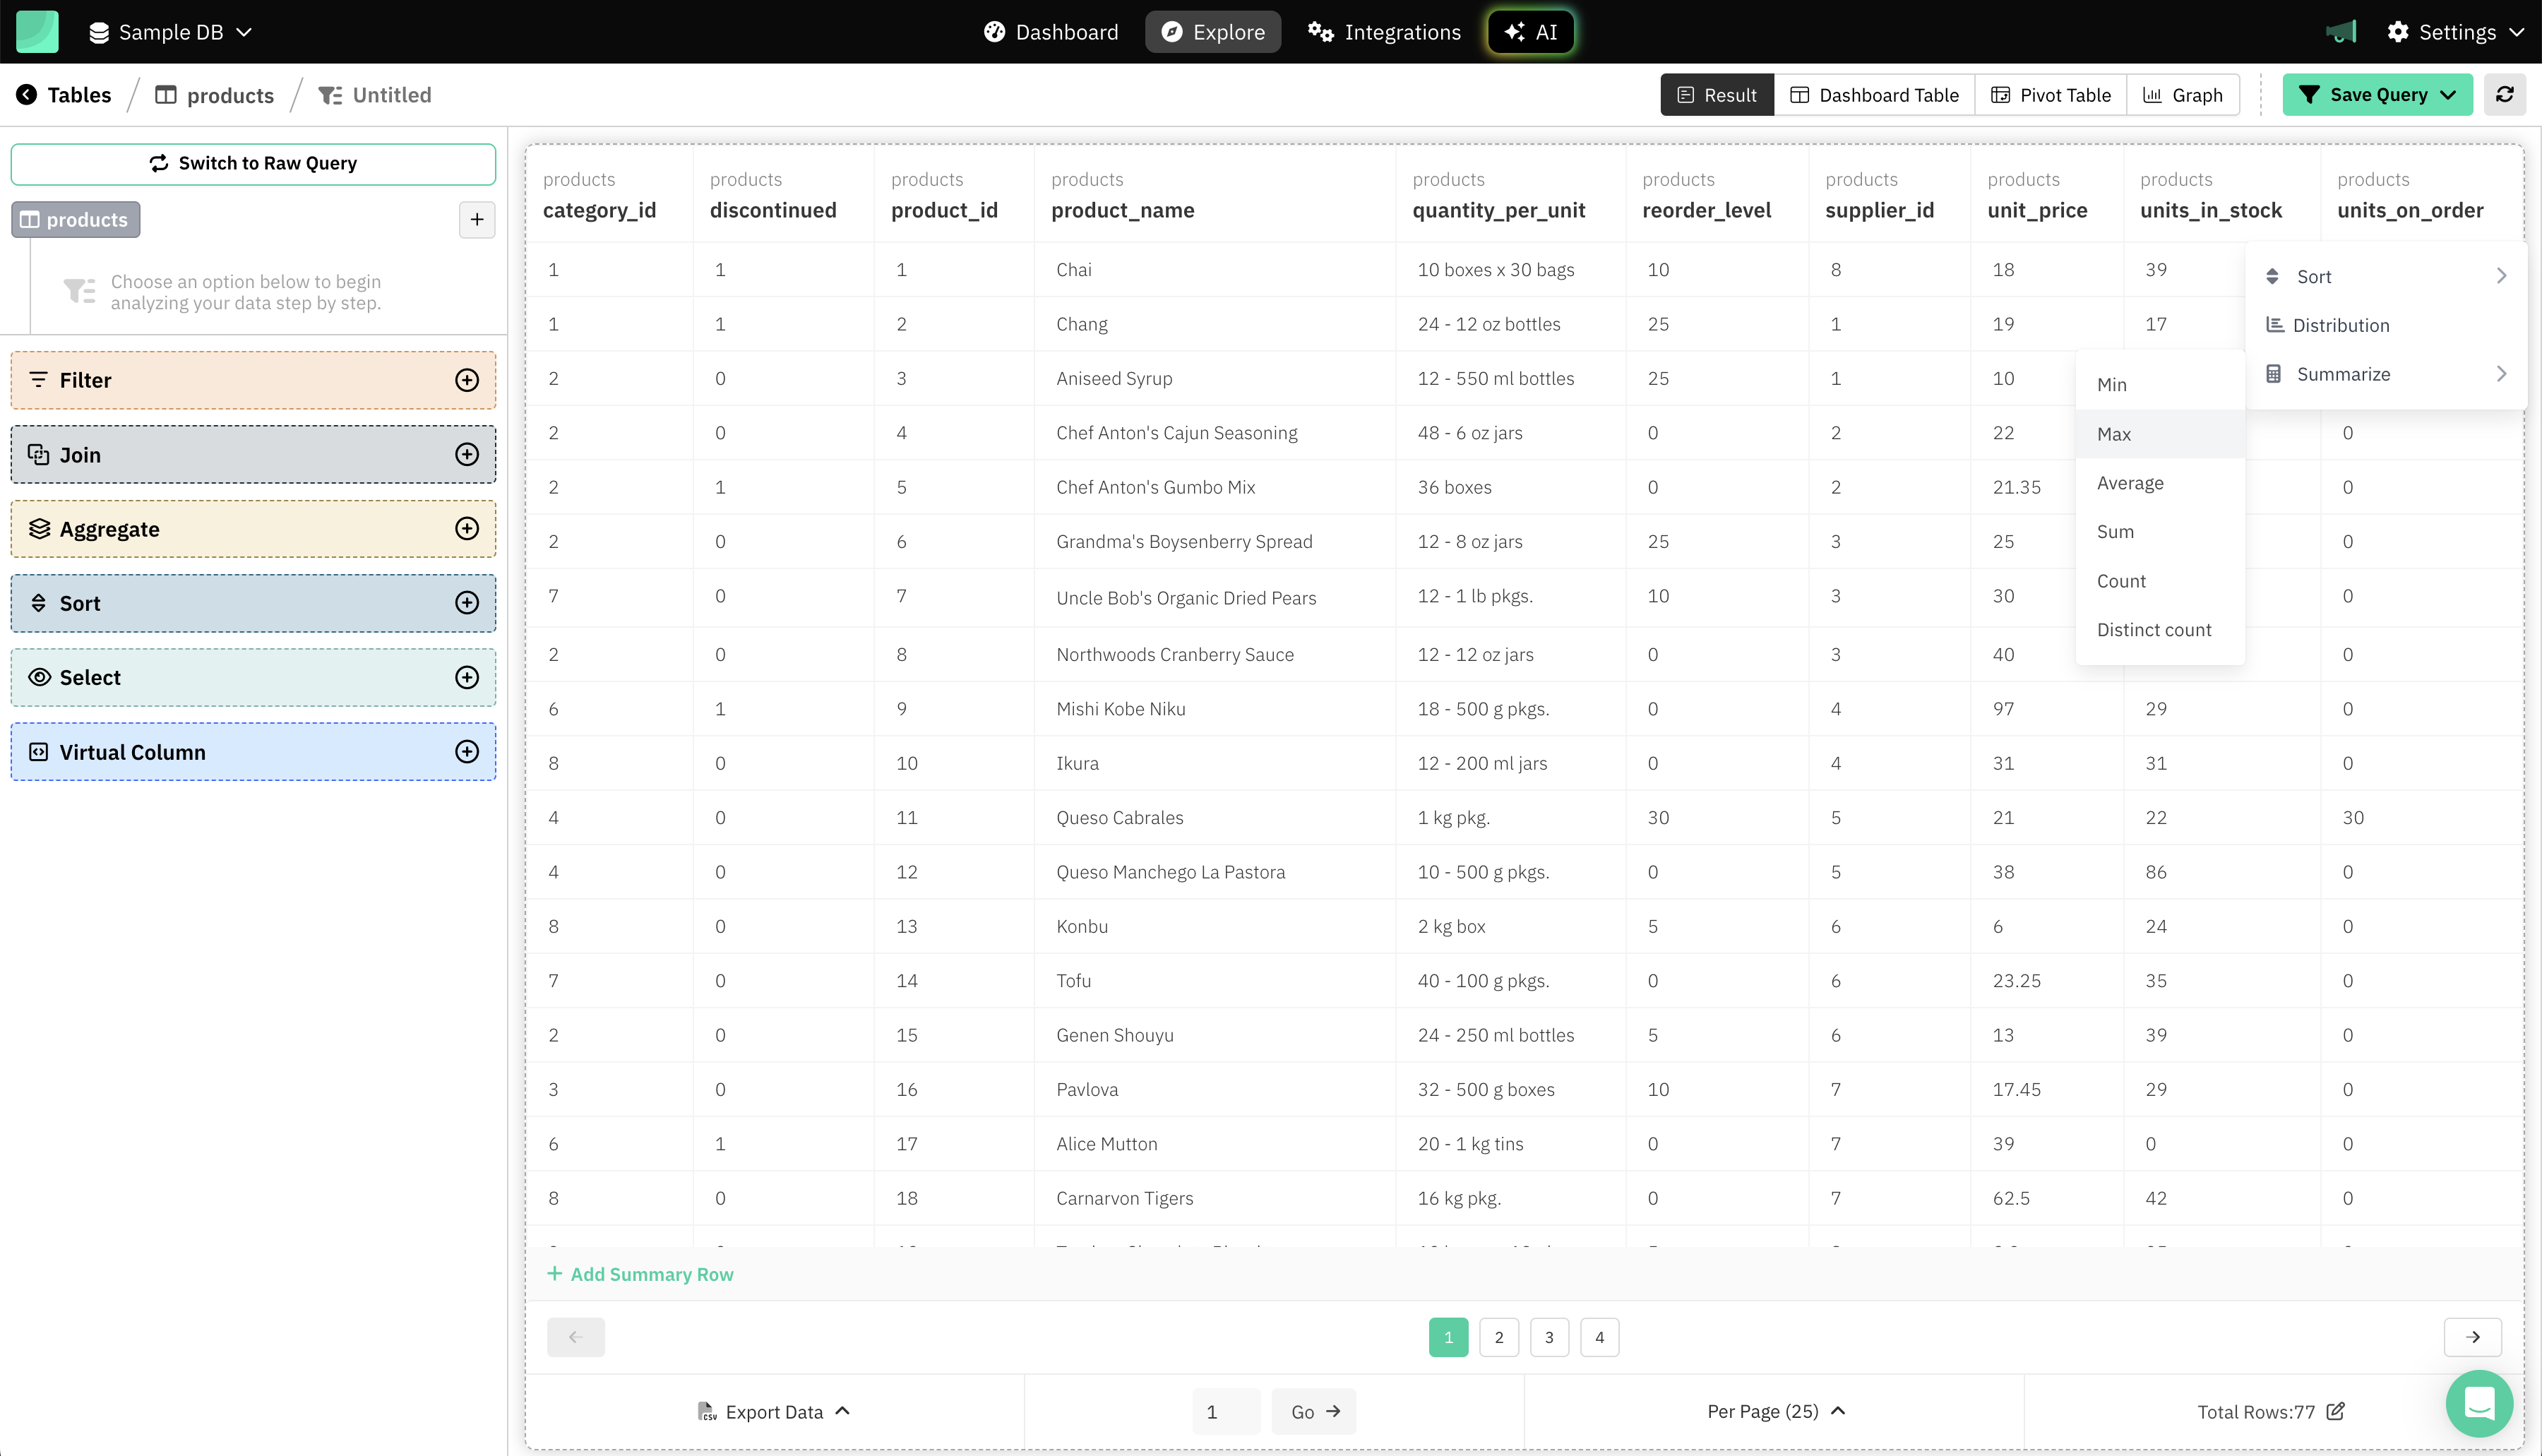
Shows a menu with these options:- Max
- Min
- Average
- Sum
- Count
- Distinct count
Note: For numeric columns, you’ll see all options; for other columns, only Count and Distinct count are available.
-
How to use:
Click the column header, then select Summarize and pick your desired statistic.
The summary value will display front-and-center in the workspace.
Tips
- These header actions work instantly, no need to build a separate query.
- Use Distribution to get a quick sense of categorical fields (like city, country, employee).
- Summarize helps you get key stats on numeric fields in just a click.