Add Dashboard Element > Saved Query
Add a saved query to a Draxlr dashboard as a chart, table, pivot table or number card, or create a new query with AI, the Visual Builder or SQL and add it.
Most dashboard elements are saved queries. Each one shows the query's result as a chart, table, pivot table or number card, using the query's saved visualization.
Here is an interactive demo of adding a saved query:
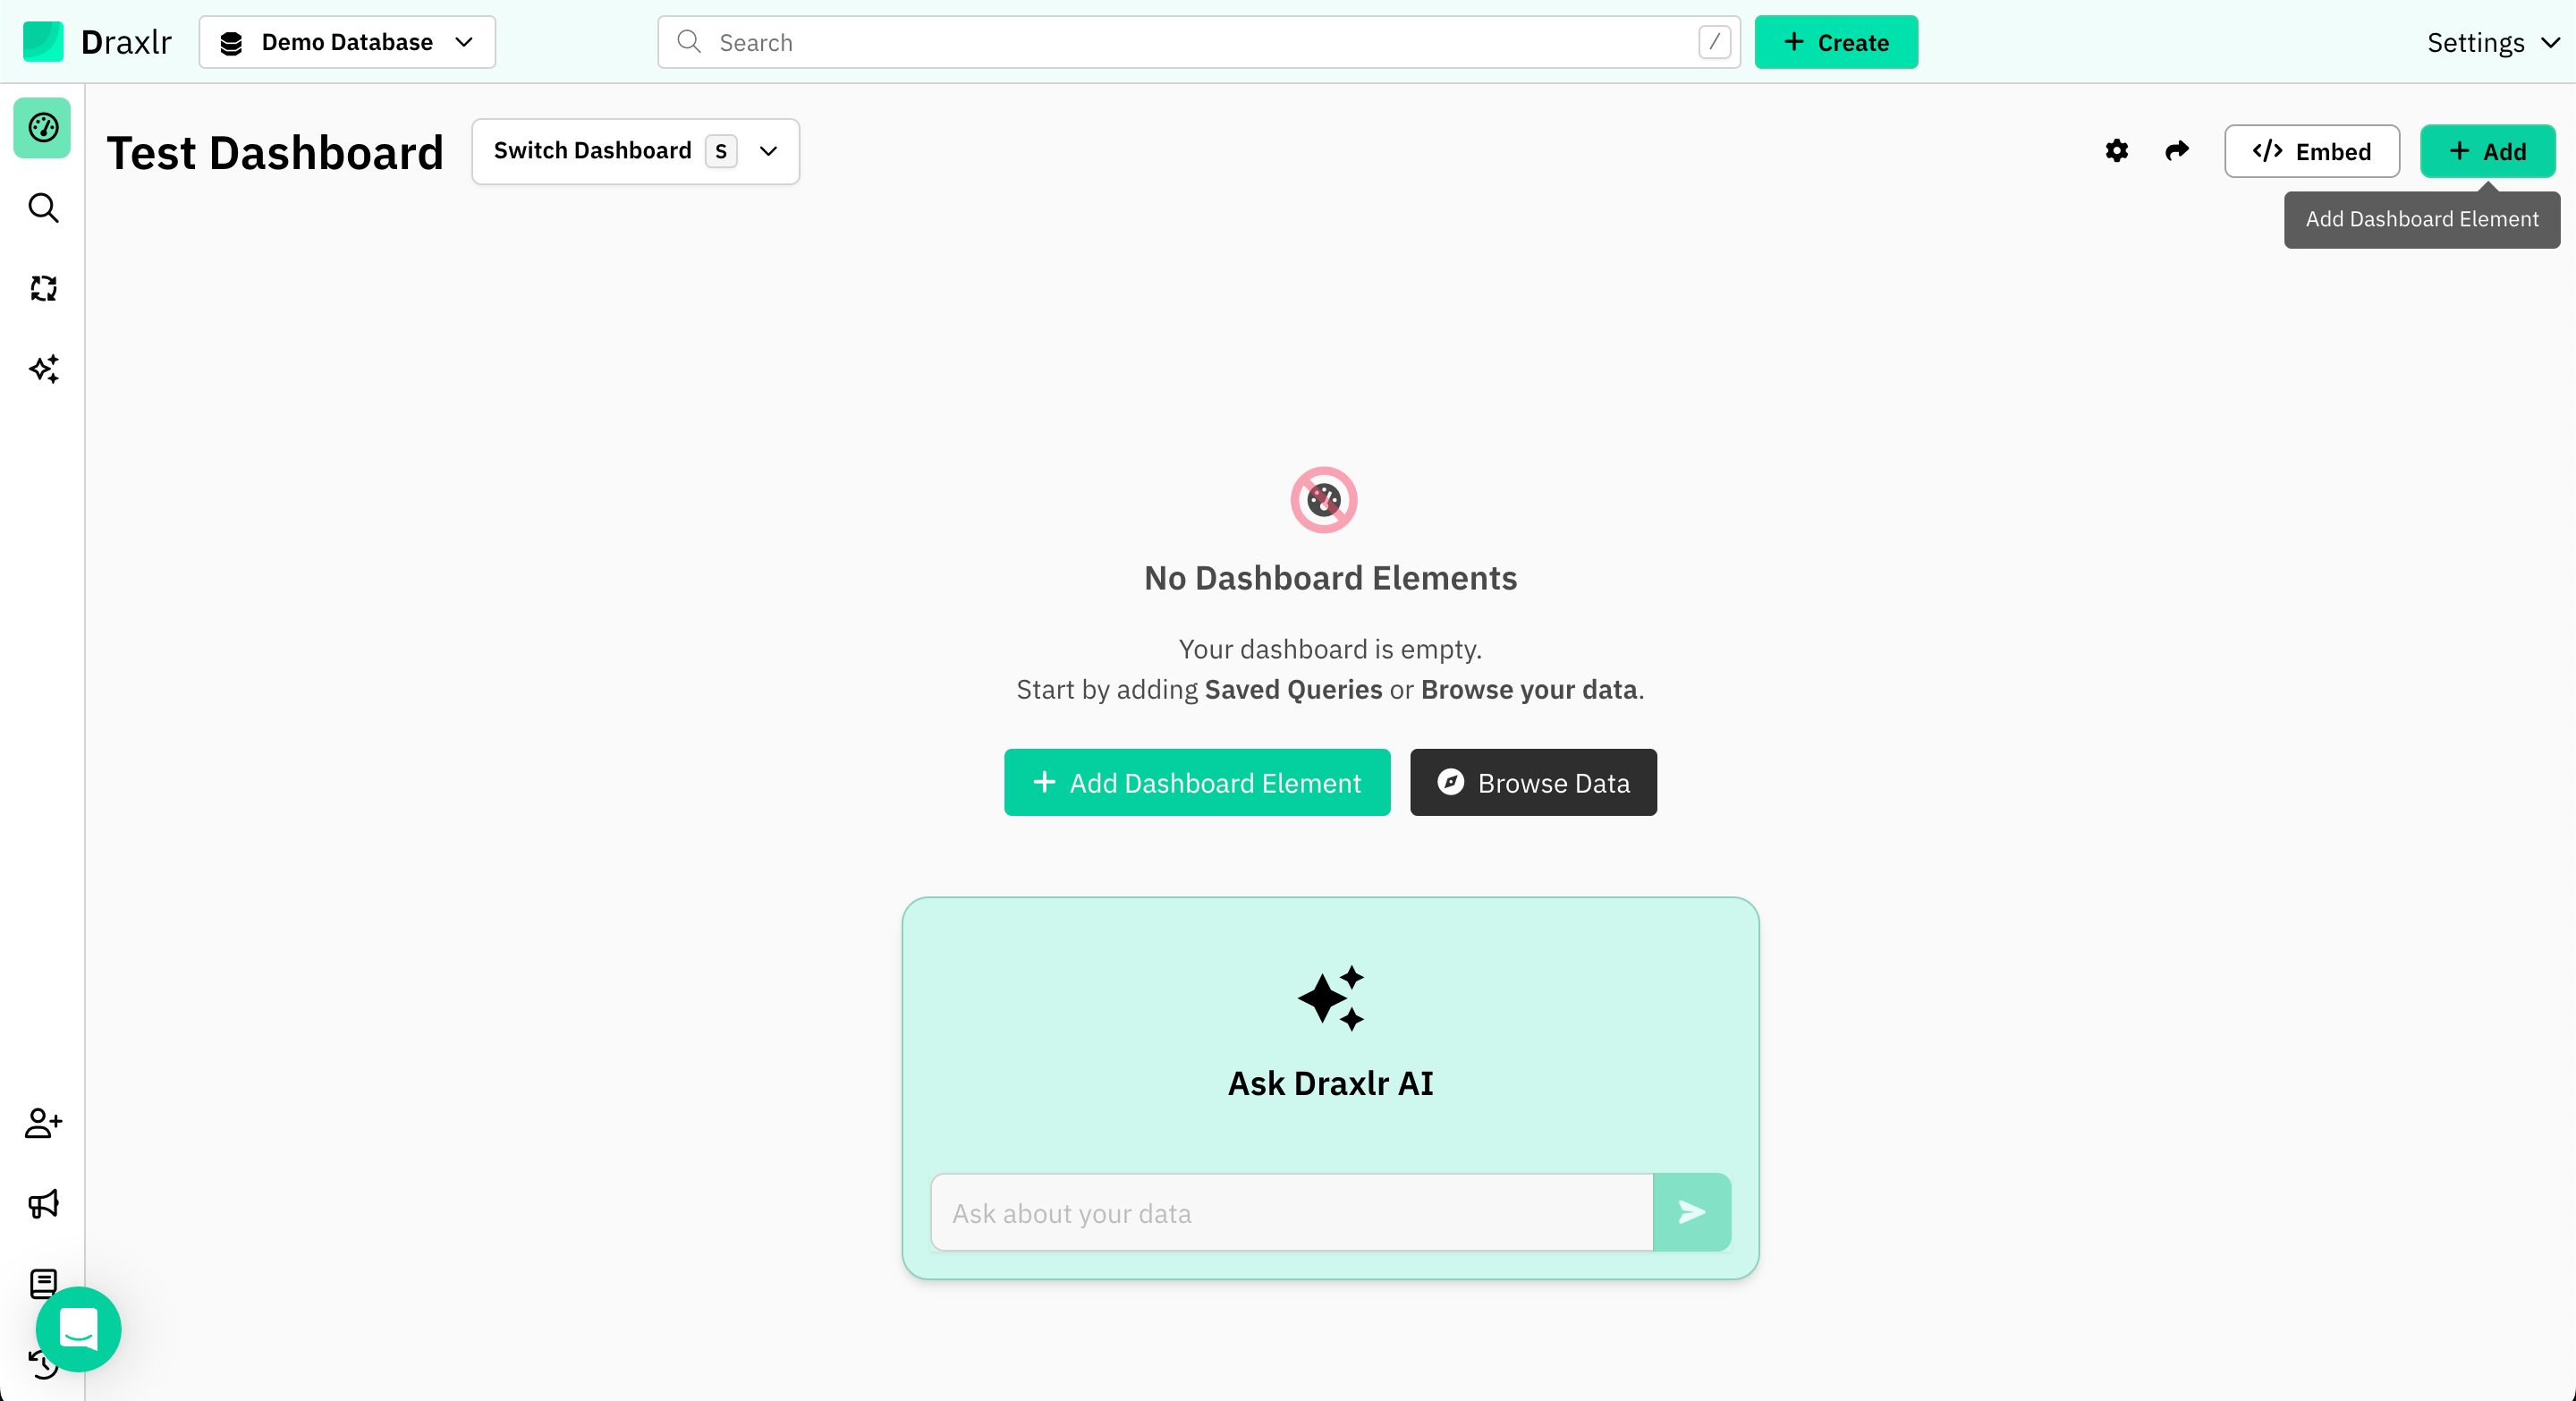
Open the dashboard you want to add to, and click Add.
Add an existing saved query
Open Add Dashboard Item
Open the dashboard and click Add in the top right corner. Then click Add existing saved query.
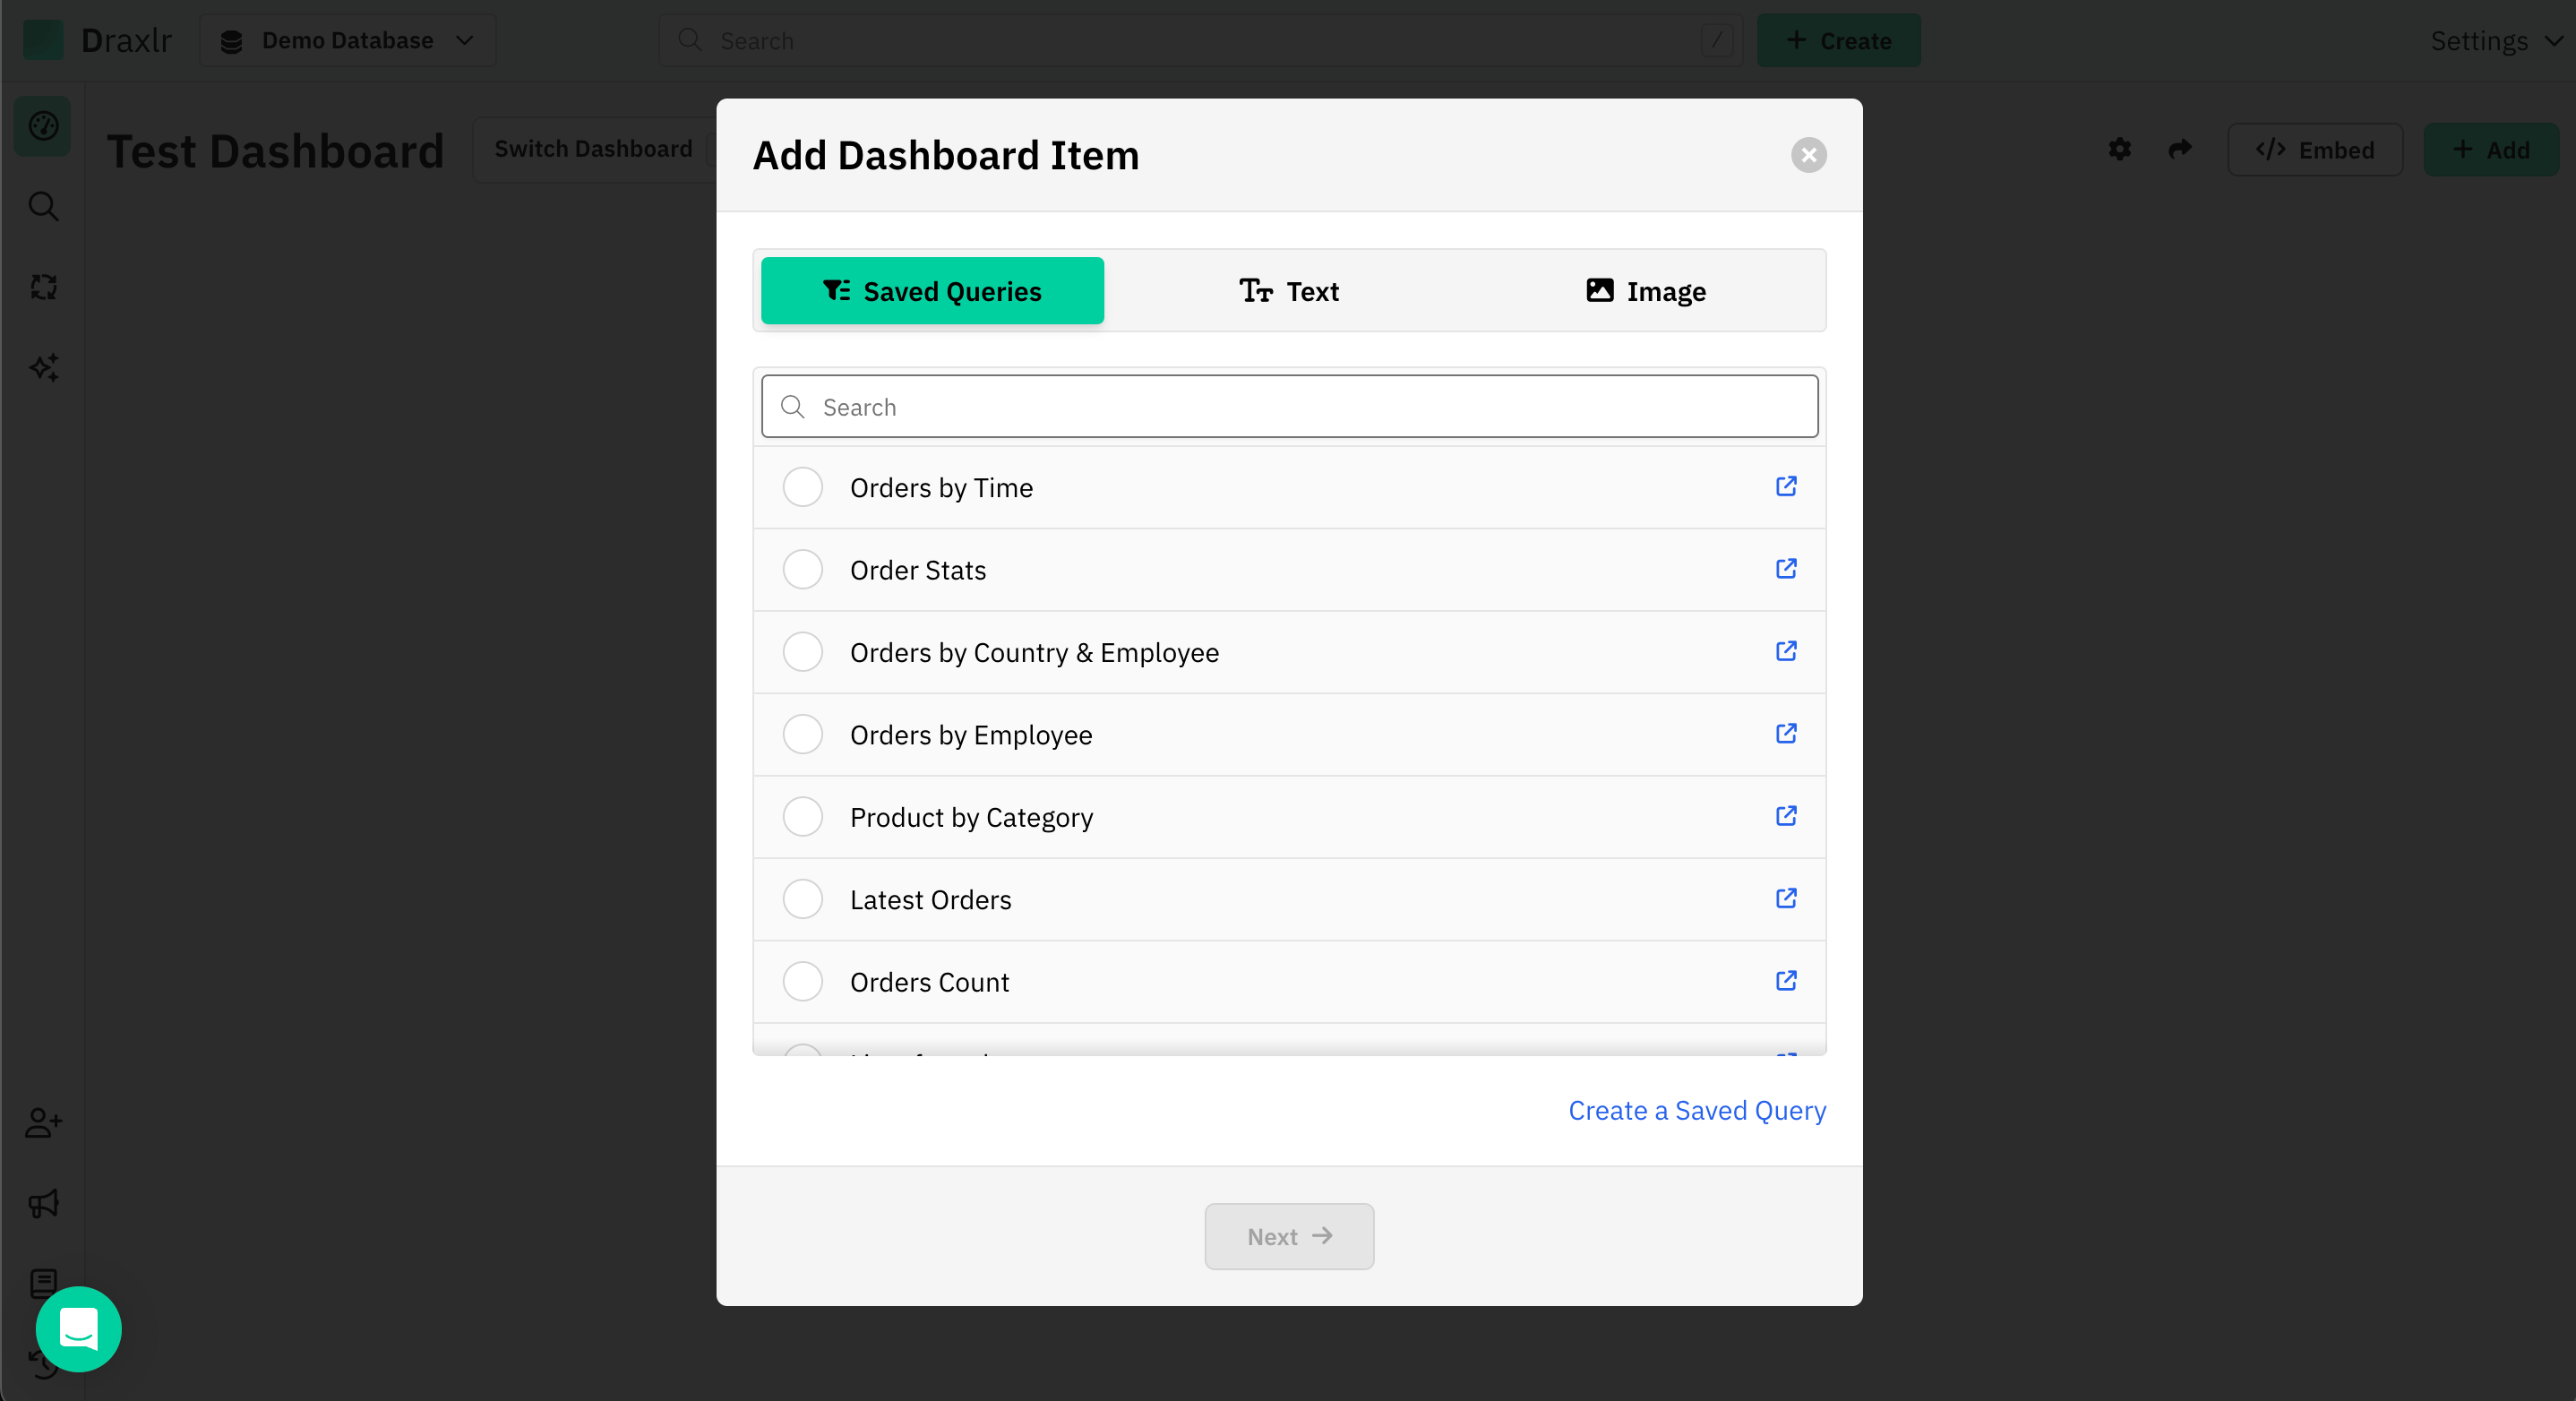
Select a saved query
Pick the query from the list, or type in Search to find it. Use the link icon next to a query to open it in a new tab.
Click Next. You can also move through the list with the arrow keys and press Enter.
Choose how it's displayed
You'll see a preview of the element, in the display type the query was saved with. Use the buttons above it to switch to another display type. Which ones you see depends on the query's results:
| Results | Display types |
|---|---|
| Several rows | Result (or Dashboard Table), Pivot Table and Graph |
| A single row | The same, plus Detail |
| A single value, such as a count | Result and Computed |
To change the chart, table or pivot settings, click the Customize link on the right, such as Customize Graph or Customize Pivot Table. The saved query opens in a new tab, where you can edit its visualization and save it.
If the query has no graph or pivot table set up yet, Draxlr asks you to set it up before you can add it as a Graph or Pivot Table.
Add it to the dashboard
Click Add Dashboard Item, or press Enter. The element appears on the dashboard, using the saved query's name and description.
Element names come from the saved query:
To rename an element or change its description, edit the saved query. See Saved Queries Management.
Create a new query
To build a query for the dashboard instead, click Create a new query, then pick how you want to build it:
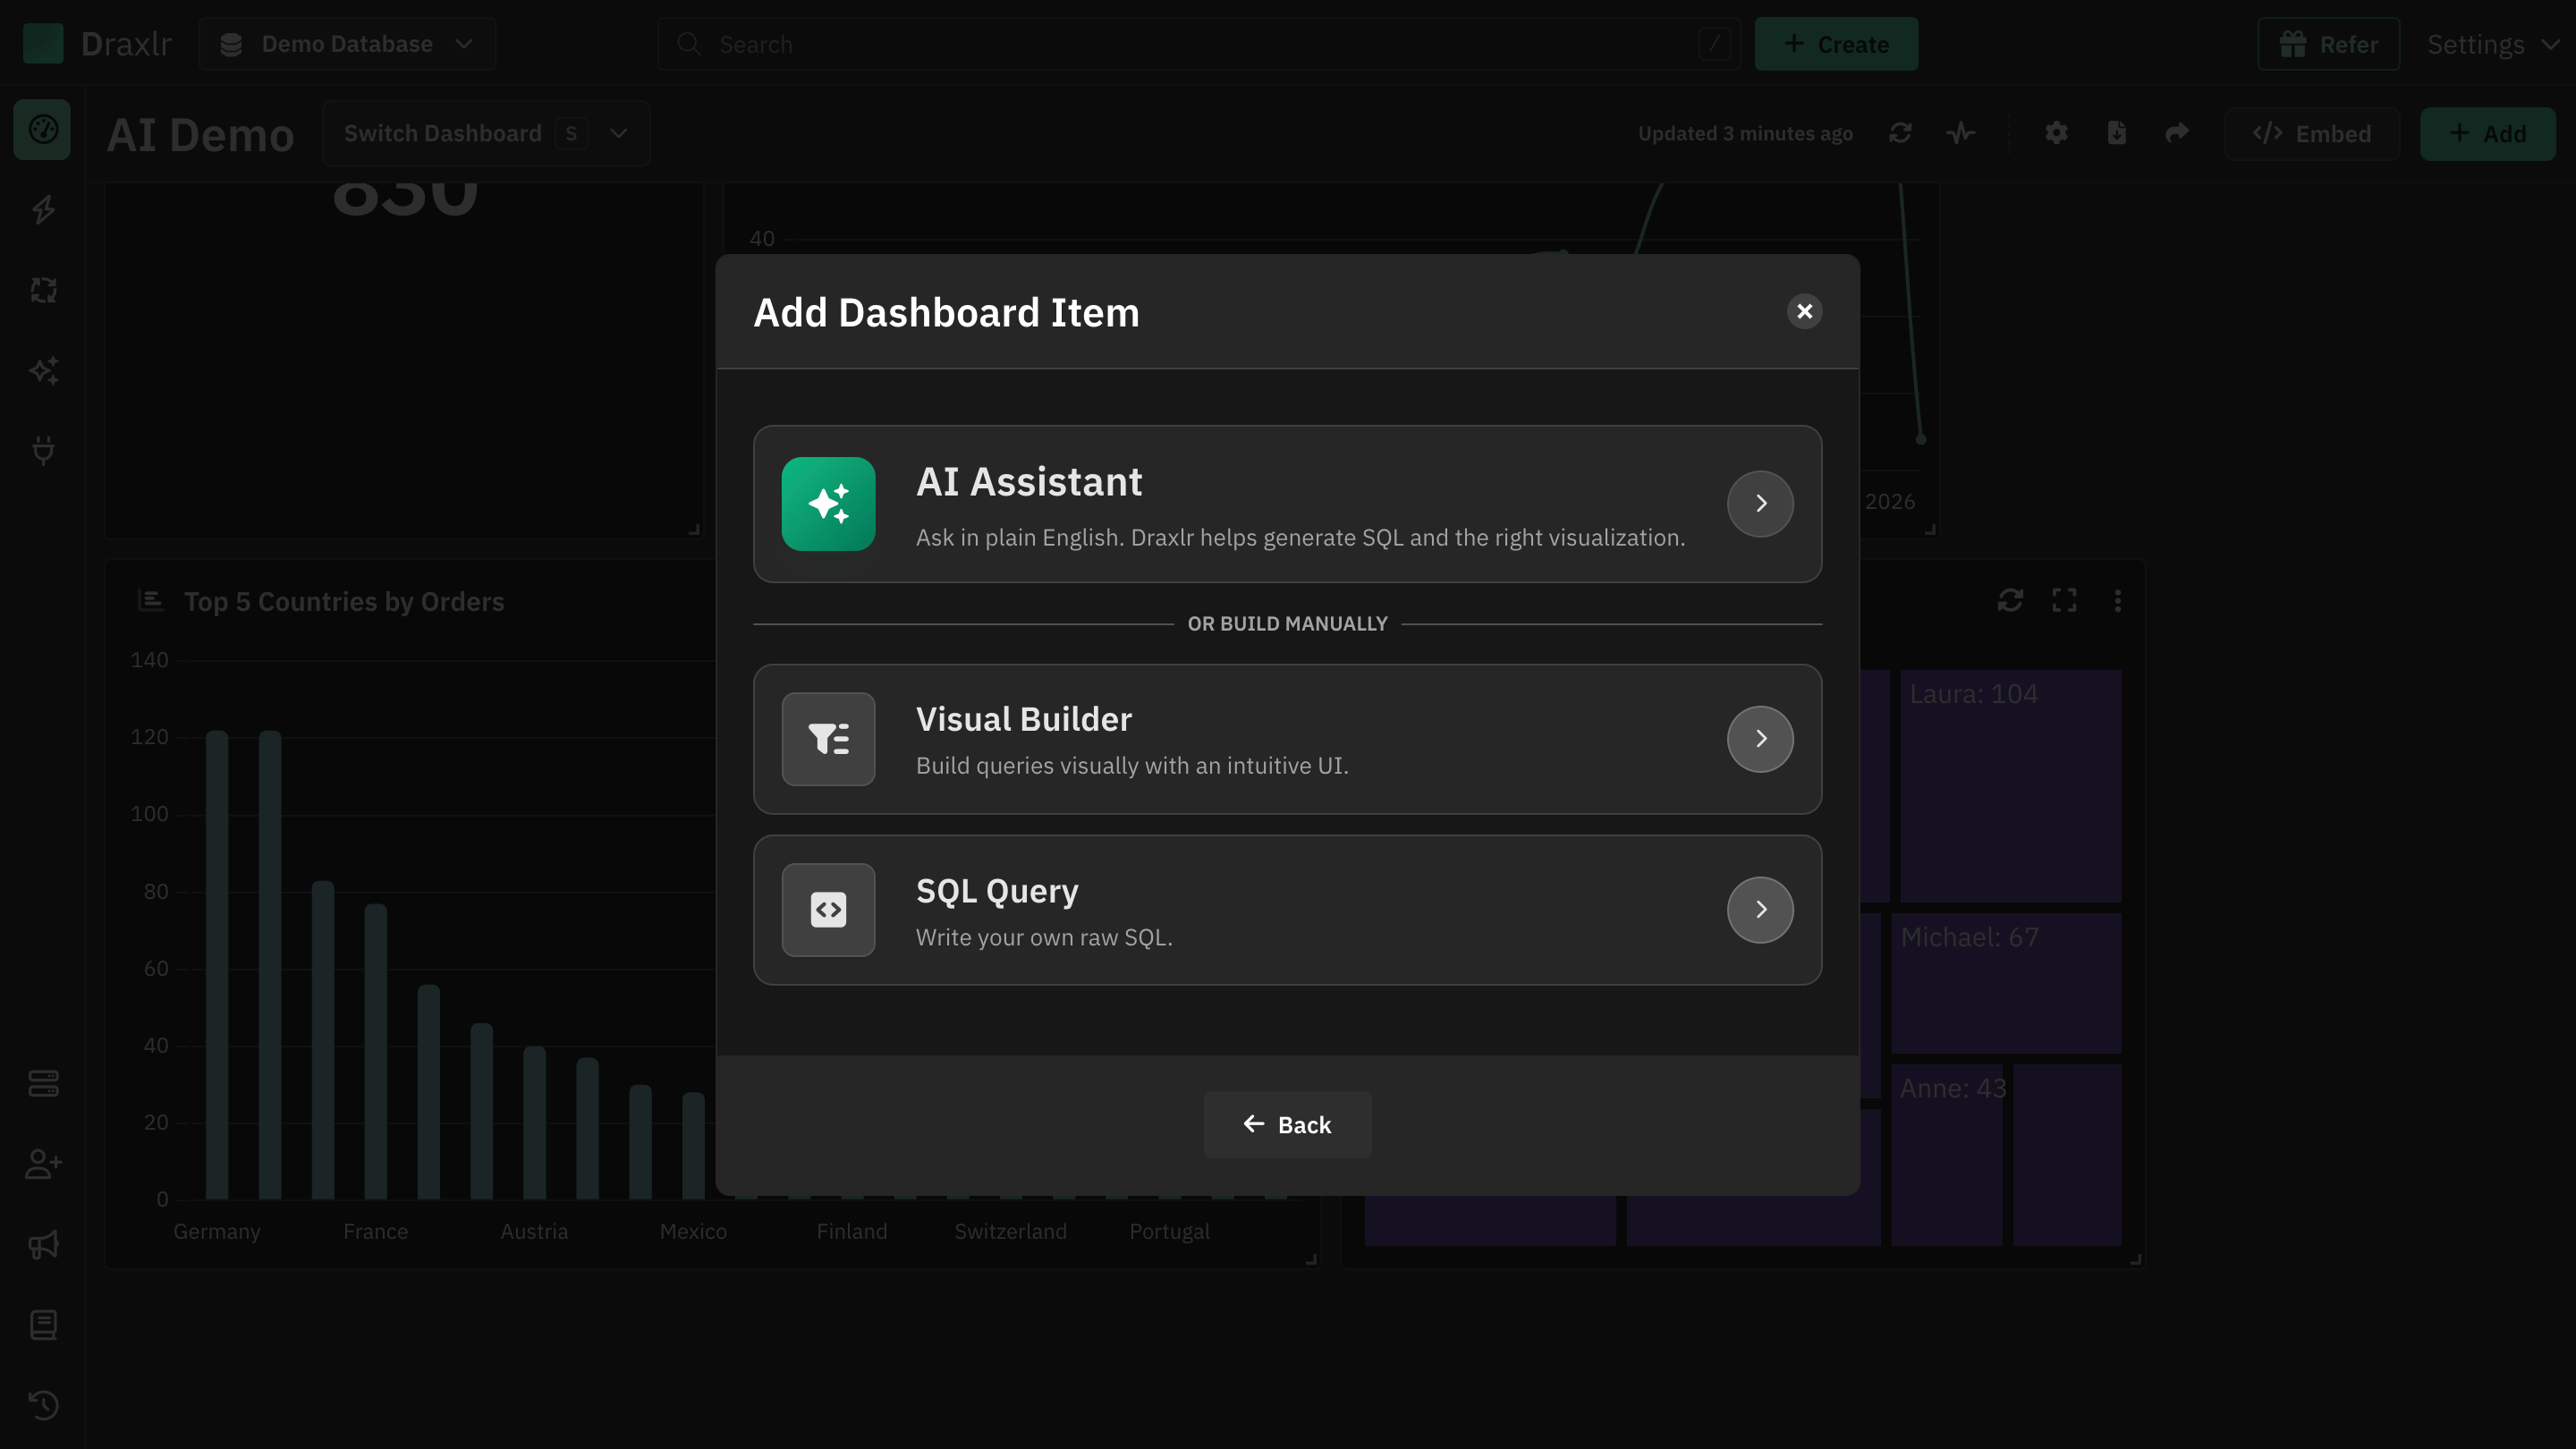
- AI Assistant: describe what you want to see in plain English and click Generate Dashboard Items. Draxlr AI writes the queries and adds the elements to this dashboard. See Generate dashboard items.
- Visual Builder: pick a table, and it opens in Browse Data so you can build the query in the Query Builder. Not available for BigQuery.
- SQL Query: write your query and click Execute Query. The query opens in the Raw SQL editor in Browse Data with its results.
To add a query built with the Visual Builder or SQL, click Save Query, turn on Add to Dashboard and choose the dashboard. You can also save it first and add it later with Add existing saved query.
No saved queries yet?:
If the database has no saved queries, an empty dashboard shows the AI Assistant, Visual Builder and SQL Query options straight away instead of Add Dashboard Item.
After adding it
- Use the element's icons and menu to refresh, expand, share, embed or download it. See Dashboard Element Options.
- To change how it looks, choose View / Edit Query in its menu, change the visualization and click Save Query.
- Remove takes the element off the dashboard and keeps its saved query.